DIGITAL ASSET RESEARCH Q3 21

WELCOME TO OUR BITCOIN (BTC) RESEARCH FOR Q3 2021. WHERE WE GO DEEP IN THE TECHNICAL ANALYSIS OF THE MAIN BITCOIN METRICS AND STATS. FROM CORE ACTIVITY ONCHAIN TO DERIVATIVES AND BITCOIN FUTURES, EXCHANGE ACTIVITY AND INSTITUTIONAL DEALFLOW (GRAYSCALE PREMIUM AND MUCH MORE)

WE ALSO GO IN DETAIL TO MAJOR BITCOIN INDICATORS THAT HELPS US UNDERSTAND THE SWINGS OF THE MARKETS AND WHERE ARE HEADING FOR LAST QUARTER (Q4 2021). SUCH AS BITCOIN DIFFICULTY RIBBON AND RIBBON COMPRESSION, BITCOIN HODLERS ACTIVITY AND WALLET MOVEMENT.

REMEMBER TO SUBSCRIBE TO OUR DEEP TECH NEWSLETTER THAT WE SEND TO OUR INVESTORS ANALYZING THE MARKETS, COMPANIES IN OUR PORTFOLIO AND MUCH MORE.

Bitcoin Q3 2021

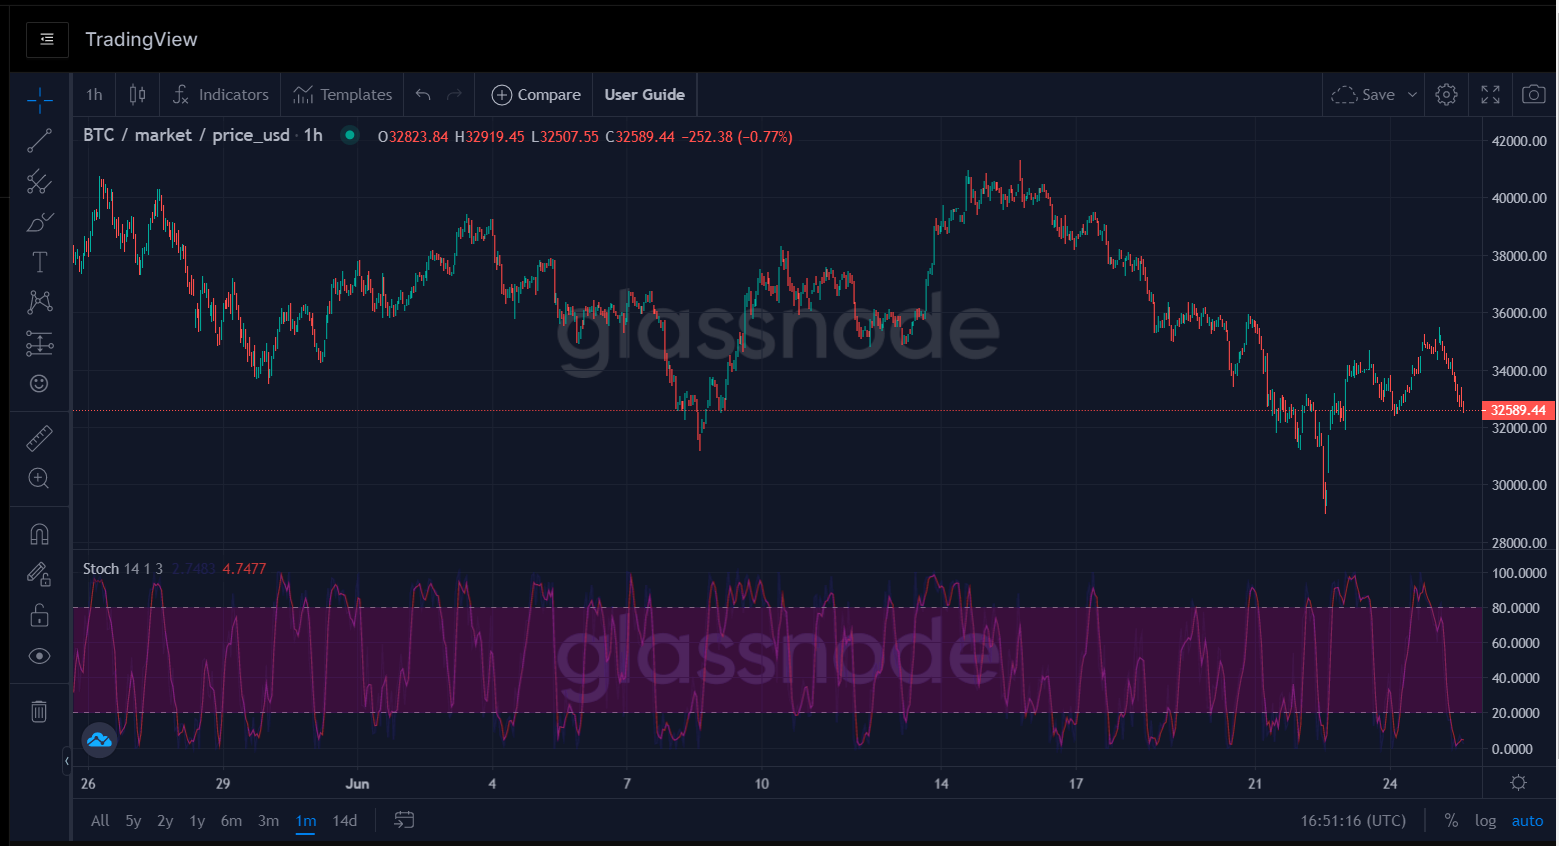
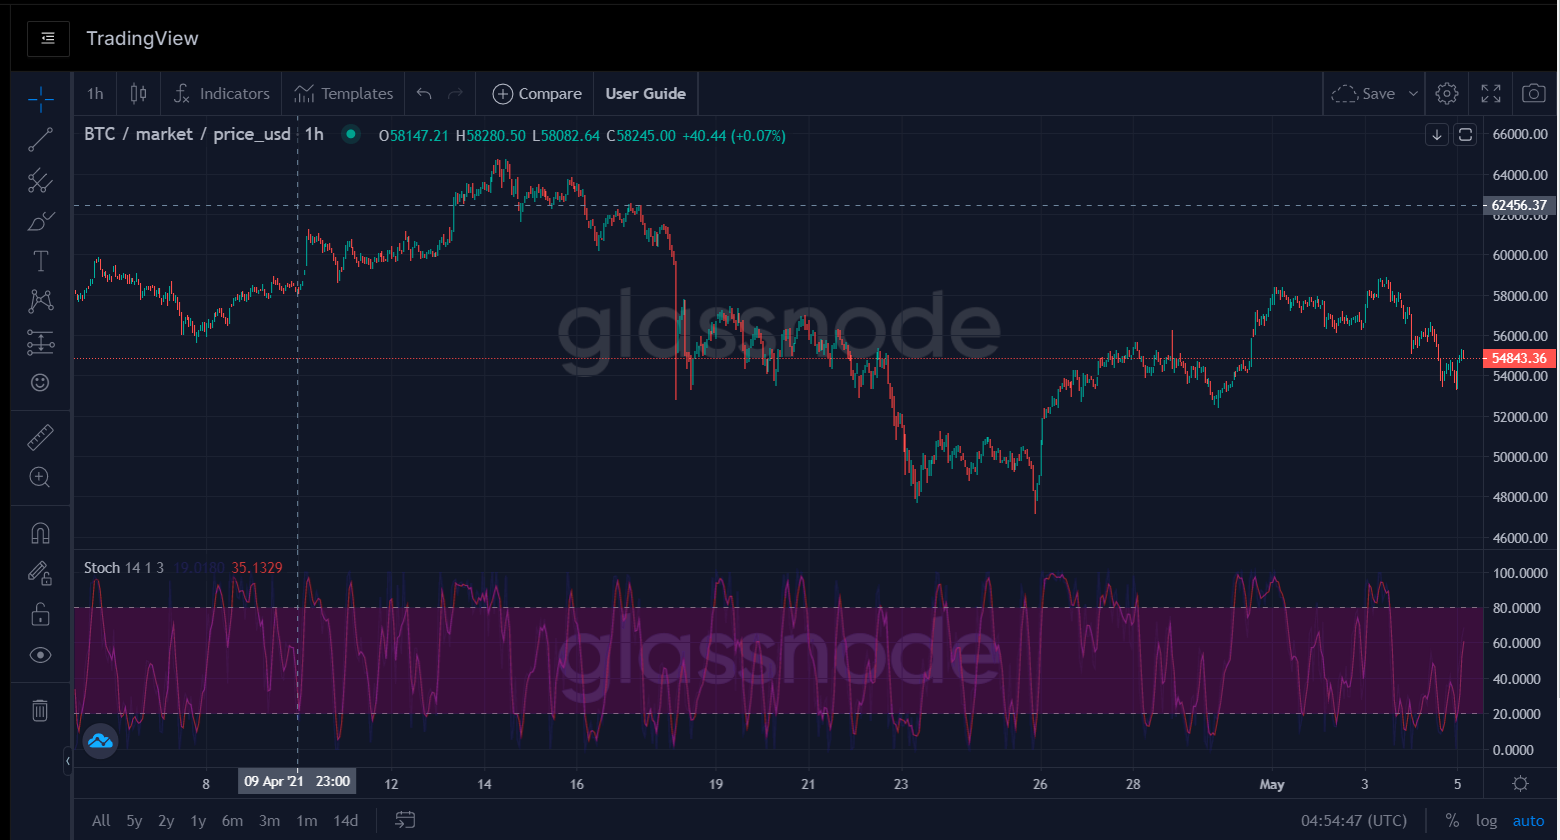
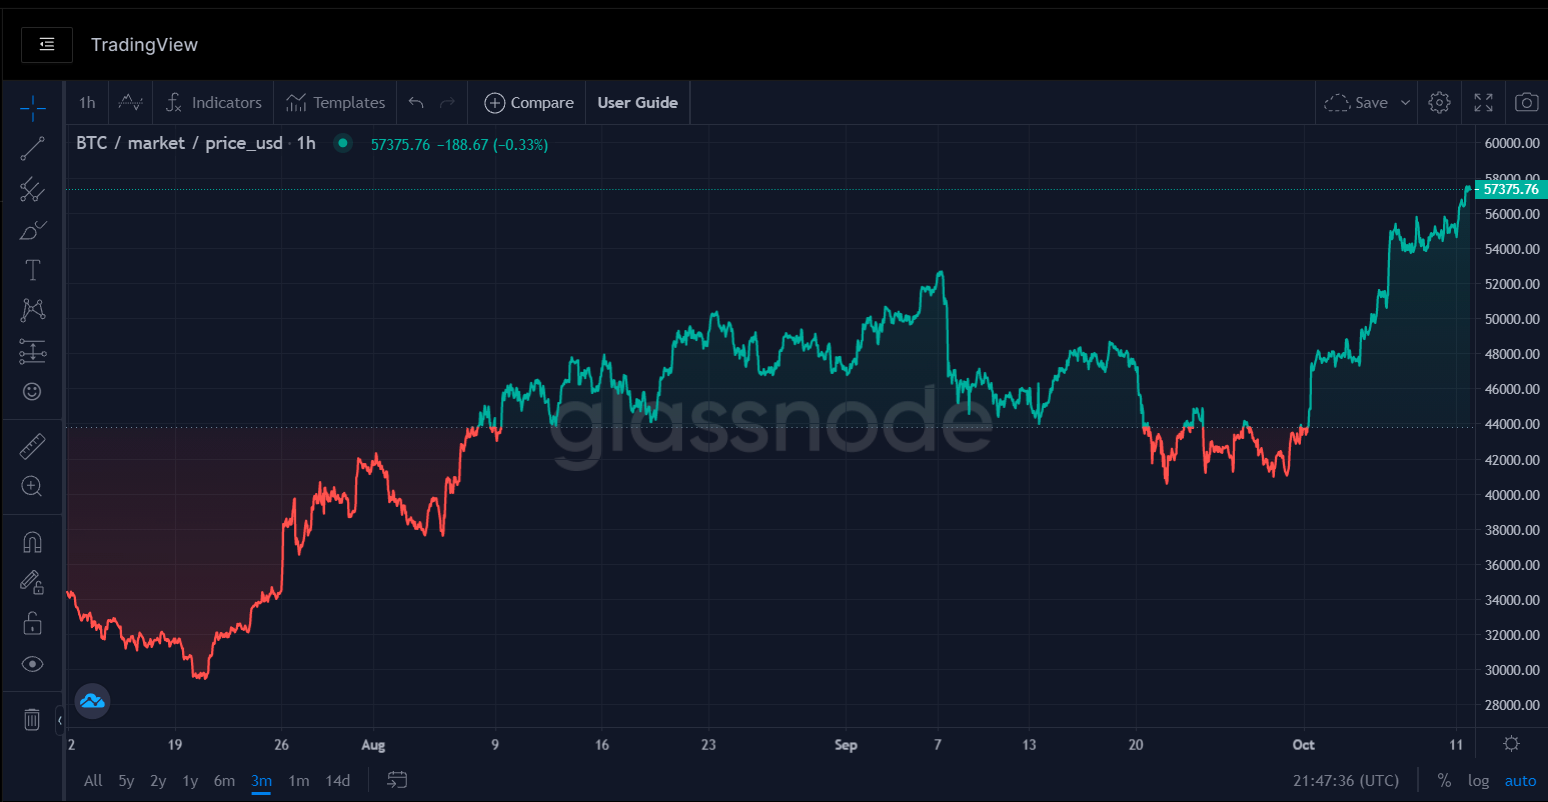
Bitcoin over the last 3 months have recovered the bullish trend it had at the beggining of the year.

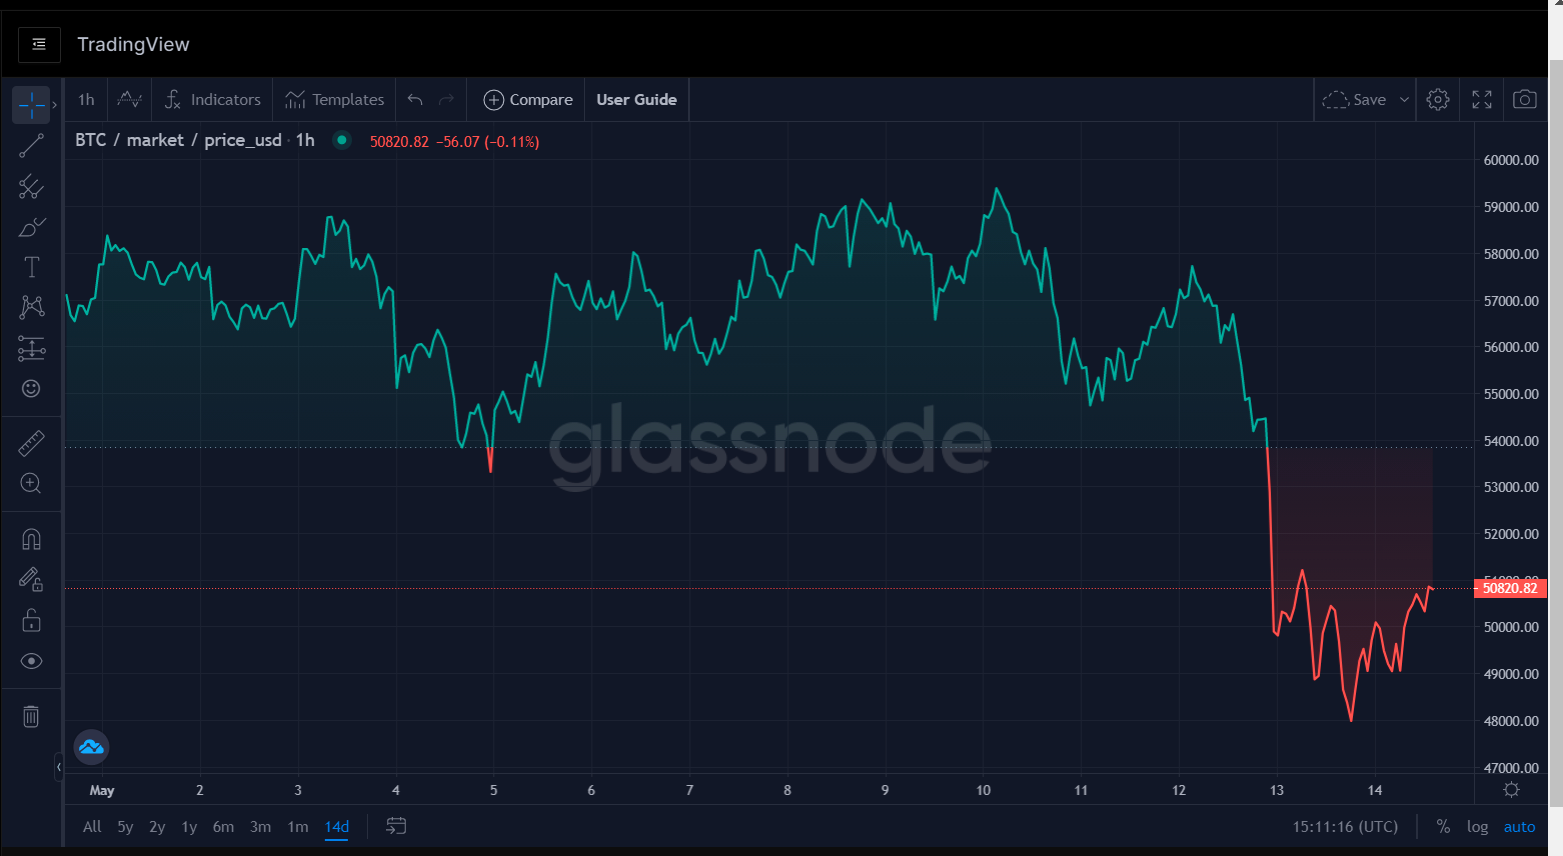
Bouncing back from the bearish trend that started back in April 13th when the price of BTC went down from 63,688 USD to 31,428 USD on June 21th.

On Q3 2021 the price of BTC was a on a sideway trading behaviour and continued the bearish trend. The price was around 34,283 USD when it decreased down to 29,351 USD on July 20th, reaching the lowest point on Q3 2021.

From there, it started a strong bullish signal in the Bitcoin price. Reaching on July an ATH of 41,965 USD. Starting the month of August it decreased to a new resistance level of 37,485 USD. From that level and almost to the end of the month on August 23th BTC reached a new all time high of 50,103 USD. In the month of September it reached a new ATH price of 52,665 USD.

It rapidly decreased down to 40,368 USD creating a new resistance level for the quarter and for September where it stayed in a sideway market up to October 1st. By then it started again the bullish trend on October 6th to 55,419 USD and currently trading over 57K USD at the time of press release.

One of the several factors that led this massive crypto bullish trend was the U.S. Fed Chair Jerome Powell reassuring investors that the central bank has no plans to ban crypto. Institutional interest also spiked on mounting speculation that the U.S. Securities and Exchanges Commission (SEC) will approve a BTC ETF in the future months. On the other hand Bitcoin Futures on the Chicago Mercantile Exchange (CME) traded at their highest premium against spot since mid-April, which leads to suggest the rise on institutional demand for crypto exposure.
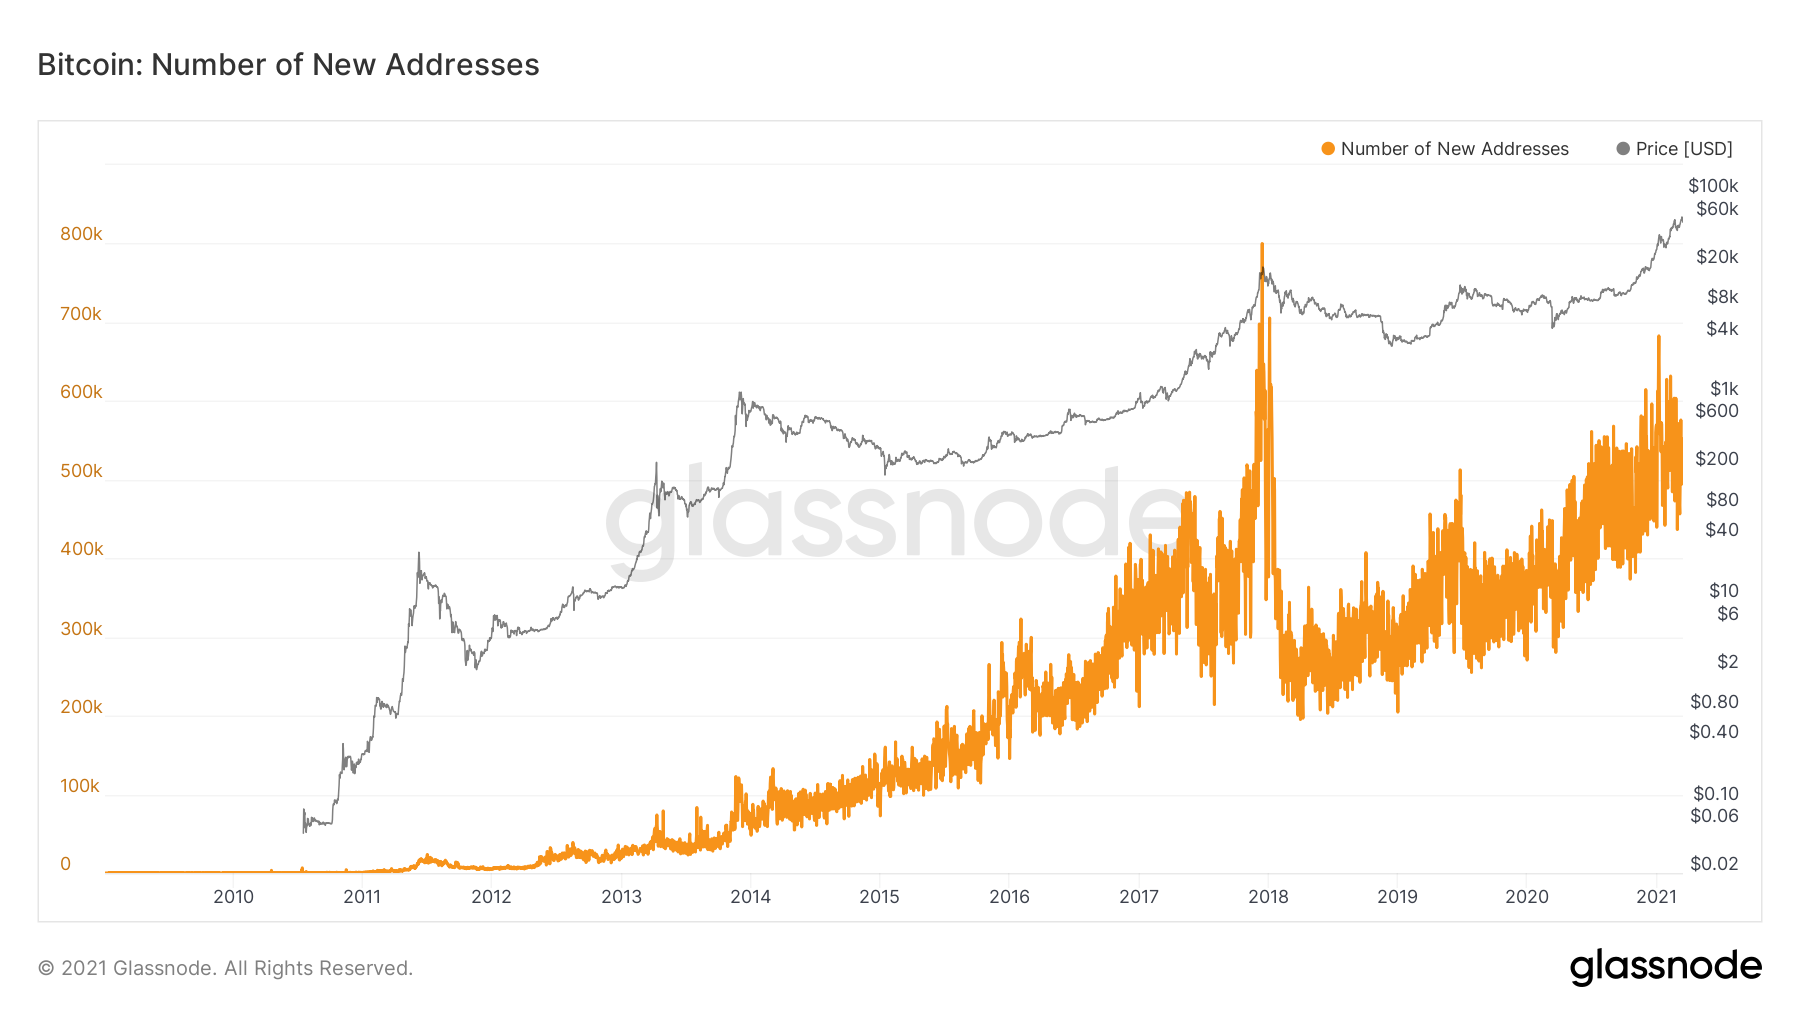
BTC WALLETS

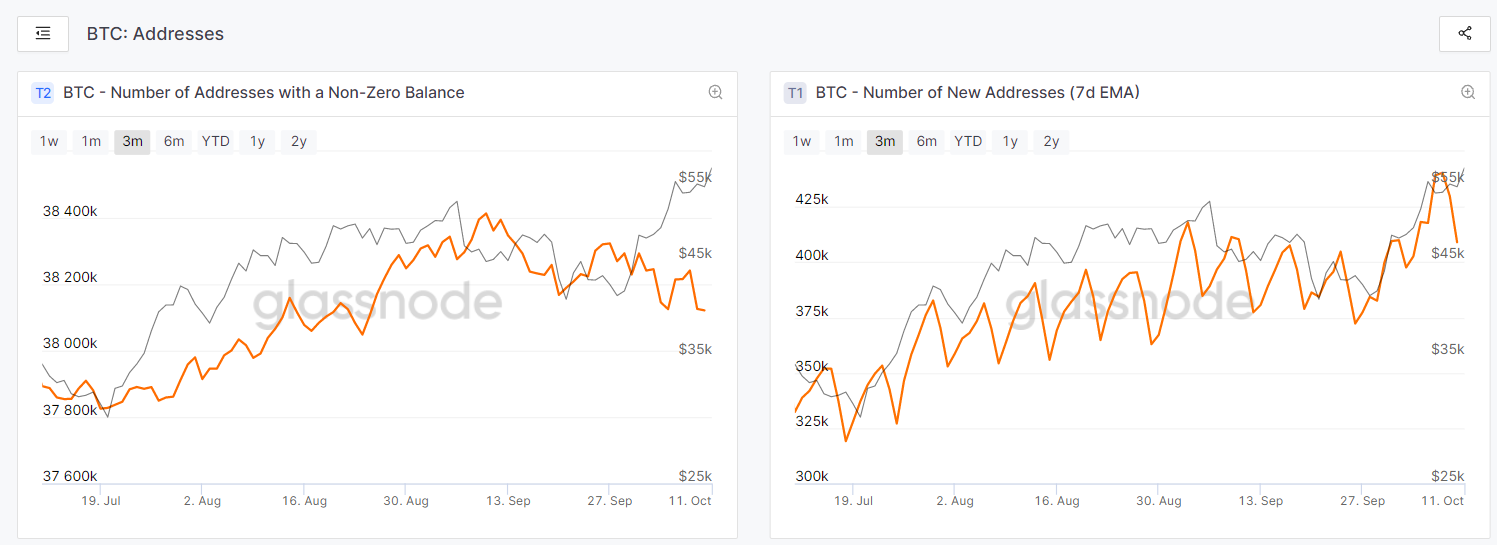
Over the last quarter the number of addresses holding a positive (non-zero) amount of coins have been increasing the whole 3rd quarter of the year. Only in September we saw a slight decline going from 38.4 MM addresses to 38.1 MM Addresses holding a positive balance. Despite that slight decline, it is still a bullish curve and an organic growth on the amount of Bitcoin Wallets. On the other hand the number of new Bitcoin (BTC) addresses created, increased during July, August and September from 342,000 new addresses to 399,000 addresses. The creation of new wallets clearly denotes the continuing global adoption of crypto and more users acquiring coins and getting started with the technology.

BTC ADDRESSES balance higher.PNG

BTC WHALES

When it comes to the Bitcoin whales, who refers to individuals or entities that hold enough cryptocurrency that they have the potential to manipulate currency valuations. Their movement have outsized impacts on the bitcoin market, either through increased volatility, decreased liquidity or a combination of both.

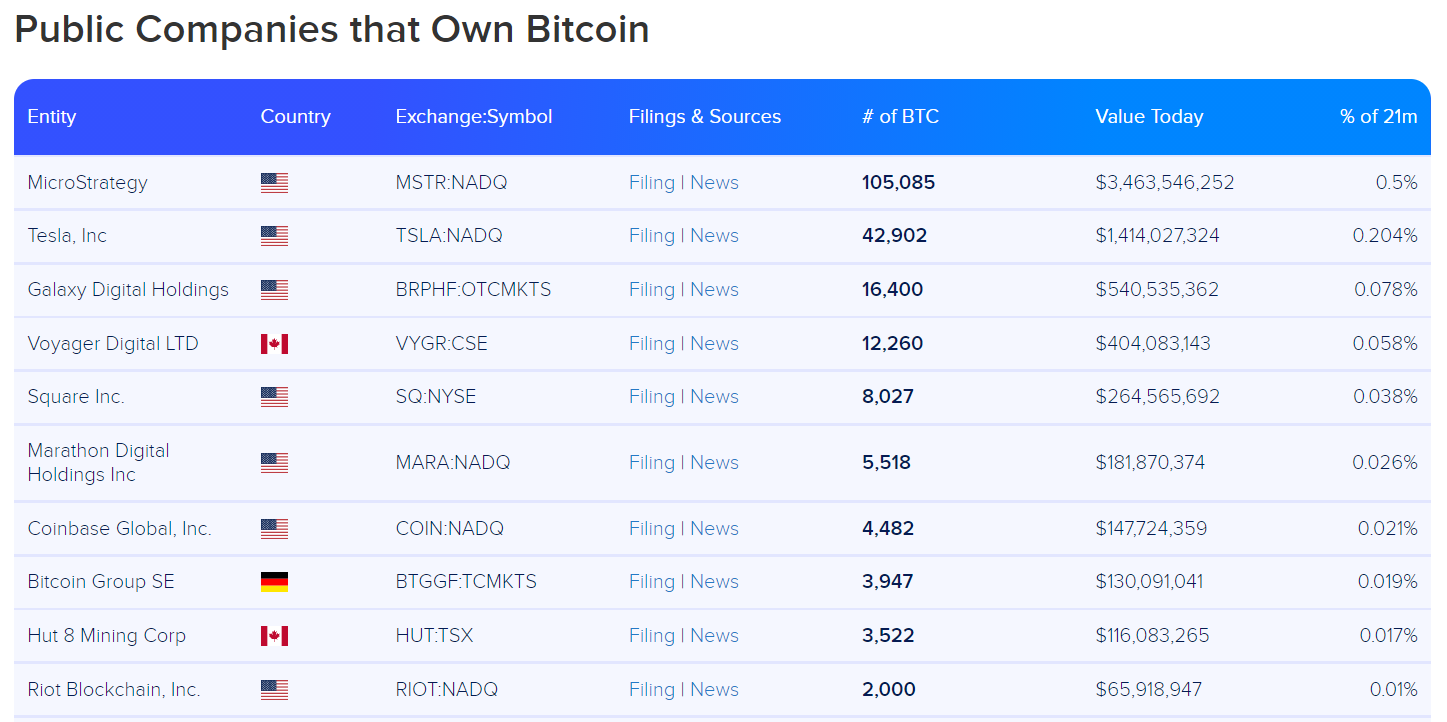
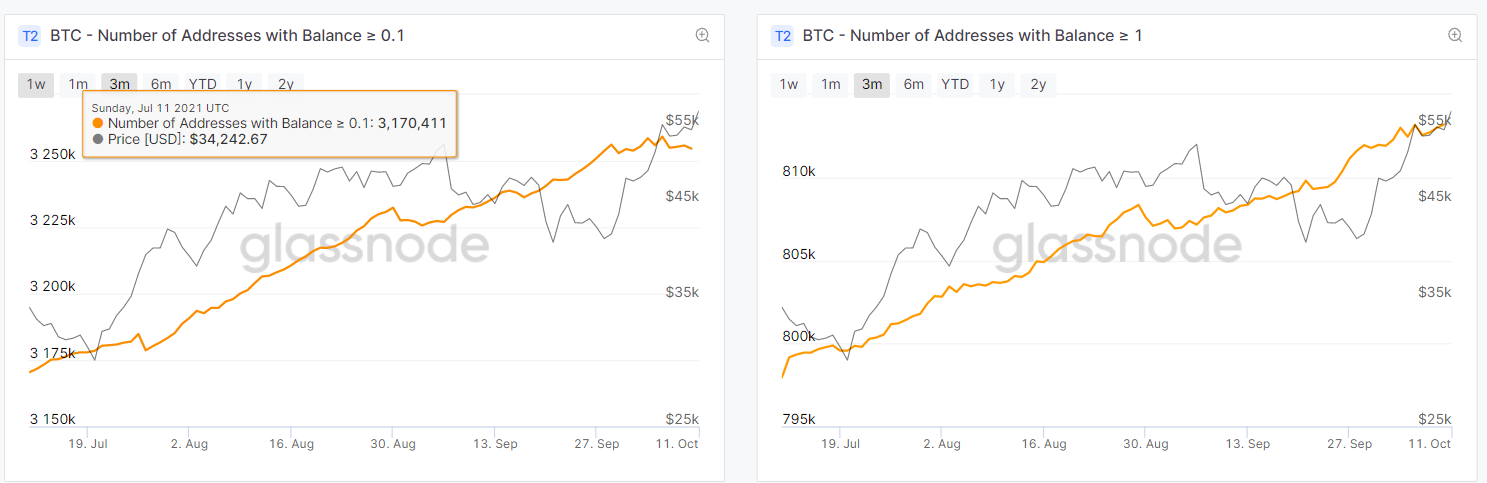
According to BitInfoCharts, just three bitcoin wallets owned 3.07% of all the bitcoin in circulation as of Q2 2021 with a value of just around $27.8 billion, and the top 100 wallets held around 18% of all bitcoin valued at around $150 billion.

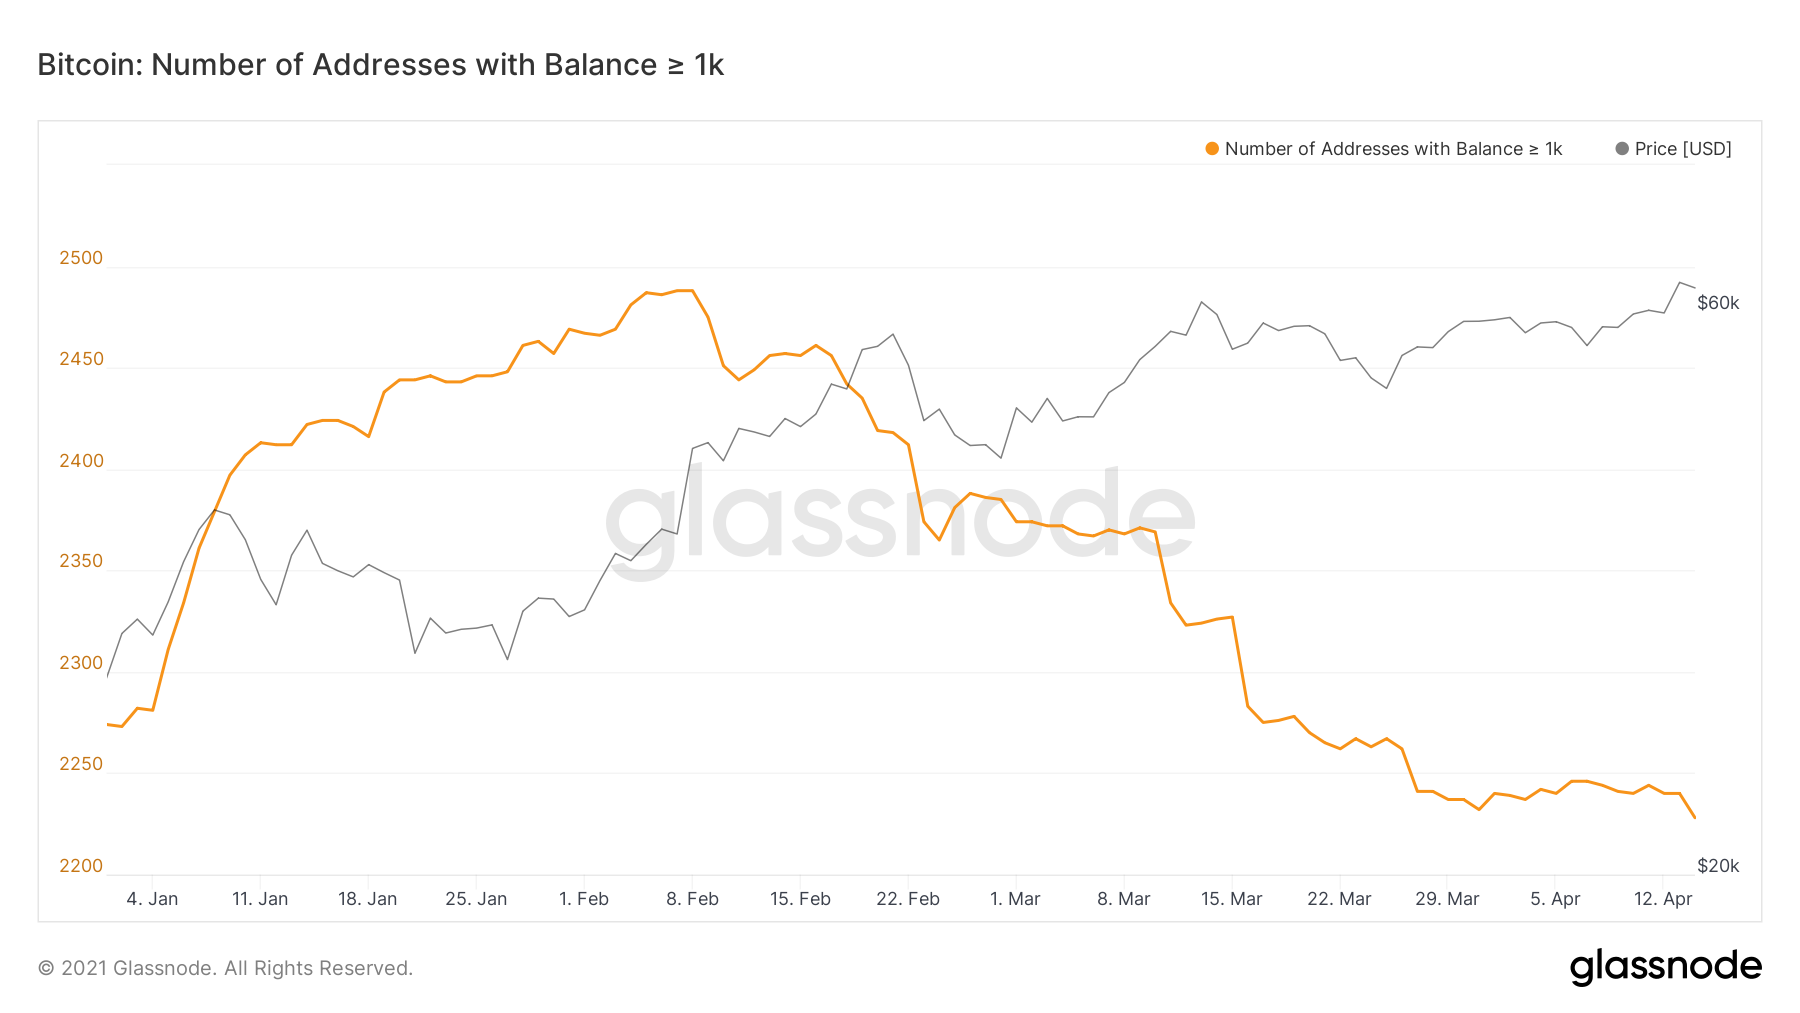
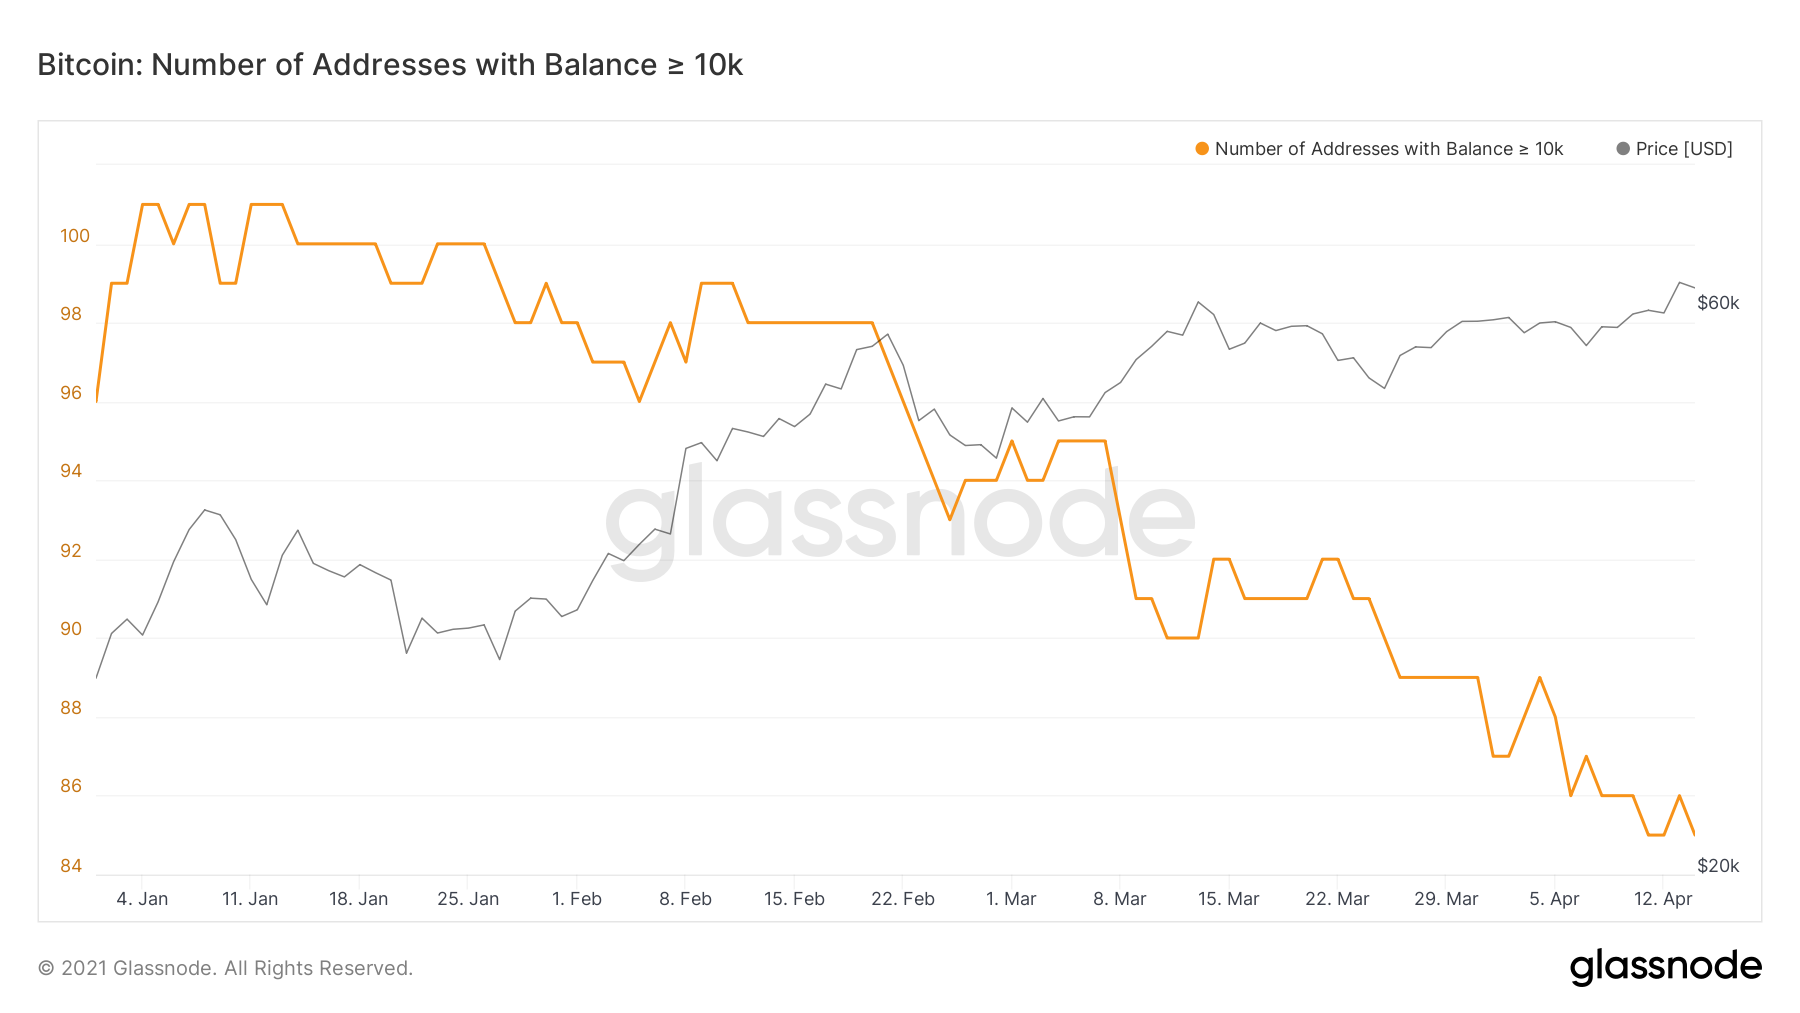
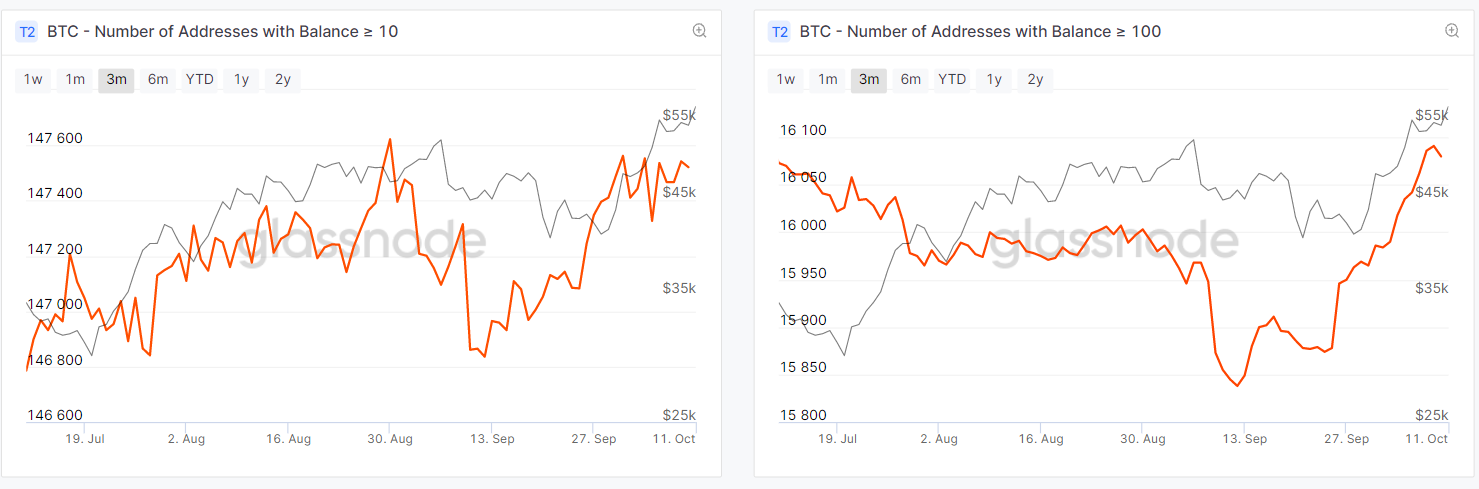
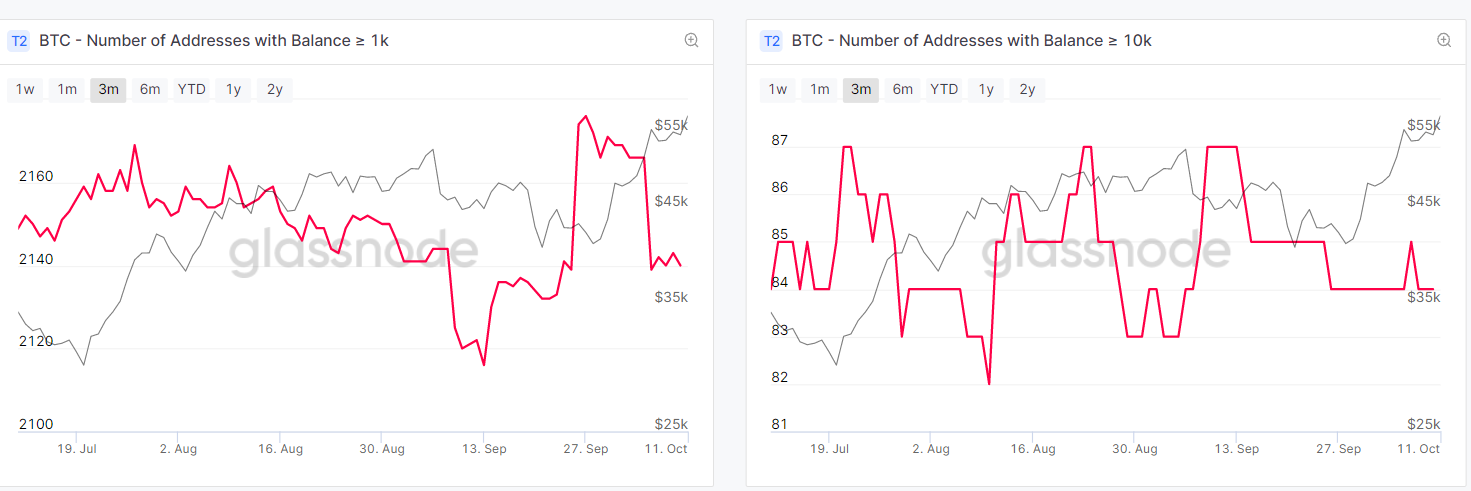
We can note that BTC addresses with balance higher of 10 BTC and 100 BTC have been increasing during the last month of September, which indicates and support the bullish trend. Also BTC wallets higher of 1K increased during the month of September from 2129 wallets to 2160. Wallets with balance higher of 10K BTC have been keeping a stable balance around 84 Bitcoin wallets.

Whales can be a problem for bitcoin because of the concentration of wealth, particularly if it sits unmoved in an account and lowers liquidity, which, in turn, can increase price volatility. Volatility is further increased if the whale moves a large quantity of bitcoin at once. If the seller is trying to sell bitcoin for state currency, the lack of liquidity and large transaction size could put downward pressure on the price of bitcoin, as other market participants see the transaction and also try to sell, creating a fire sale.

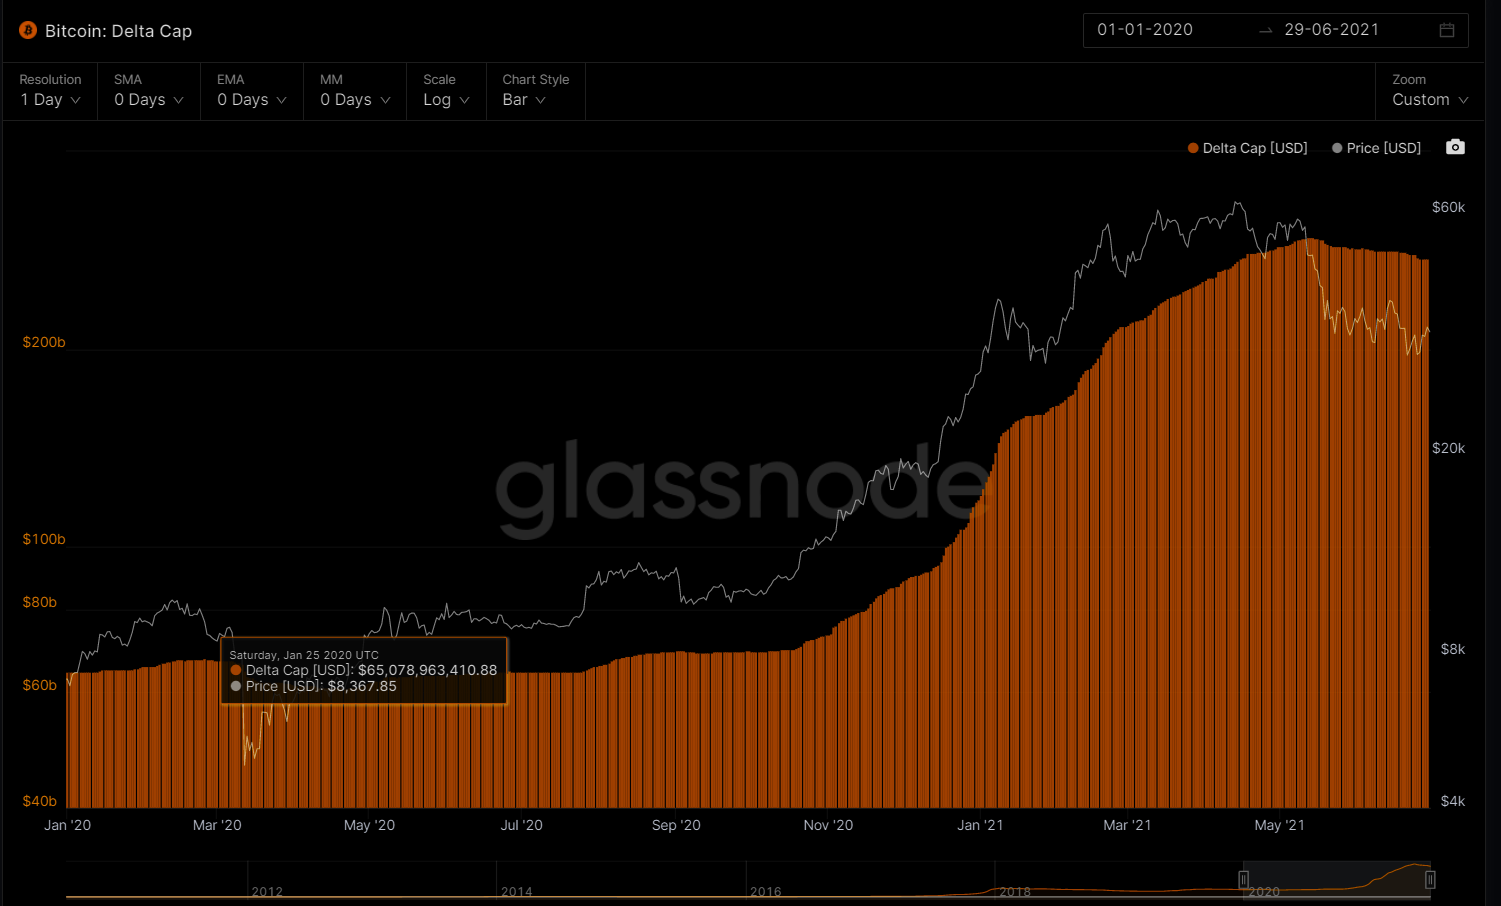
BTC HODL WAVES & REALIZED CAP

When observing the behaviour of HODLERS and how the Bitcoin Investors according to their age are moving the coins in the network we can denote the following trend in the 1st semester of 2021.

  • Long term investors (smart money) holding their Bitcoin (BTC) in the range of 7-10 years which represents together almost 18% of the population of investors. Maintained a steady balance during the first 6 months of 2021. That could be interpreted as sophisticated investors both individual and institutional that understand the value of the network and the value of Bitcoin as a long term asset which expect a higher ROI by the end of the year or in the long term.

  • Similar behaviour occurred for investors holding their coins in the range fo 1-7 years. Representing almost 37% of the population at the beggining of 2021. The investors between 1-2 years went down from 10.34% in January 2021 to 8.92% representing a small sell of their Bitcoin Holdings.

  • The major movement occurred for investors holding their coins between 6-12 months which increased from 7.7% up to 19.7% which provides a signal of short term buyers trying to gain more coins during the bullish trend.

BTC CORE CHAIN

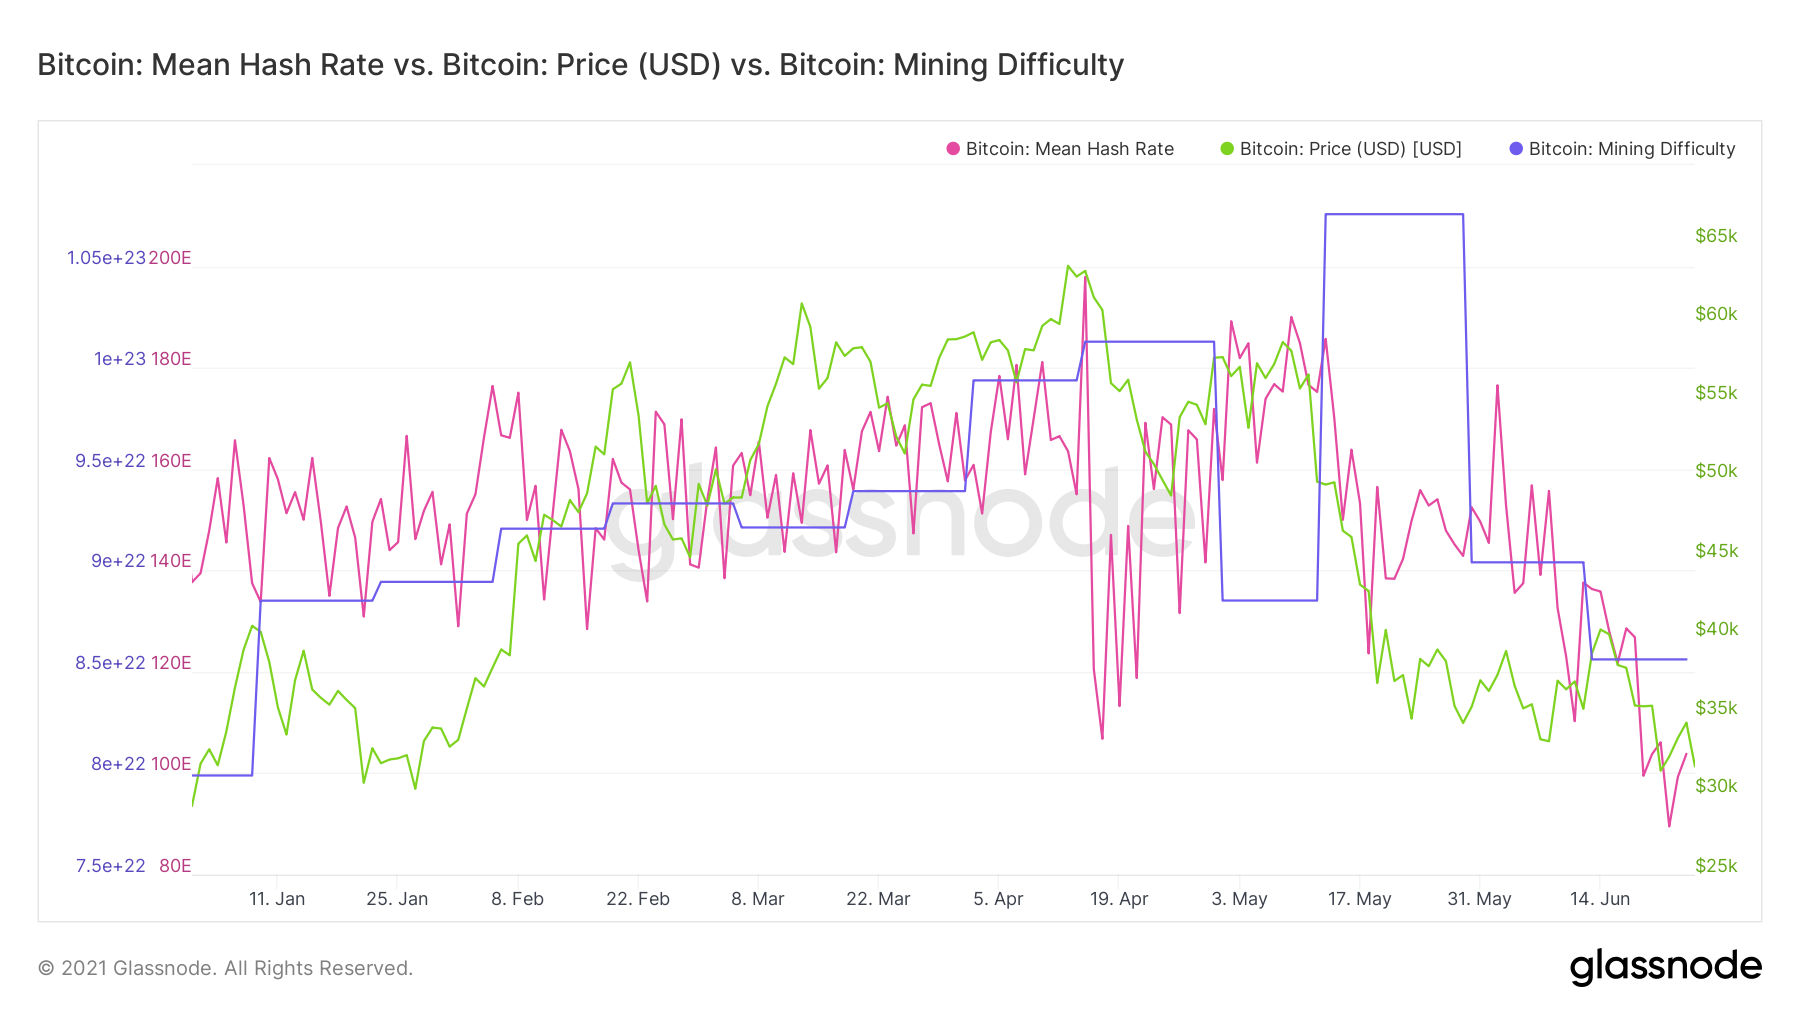
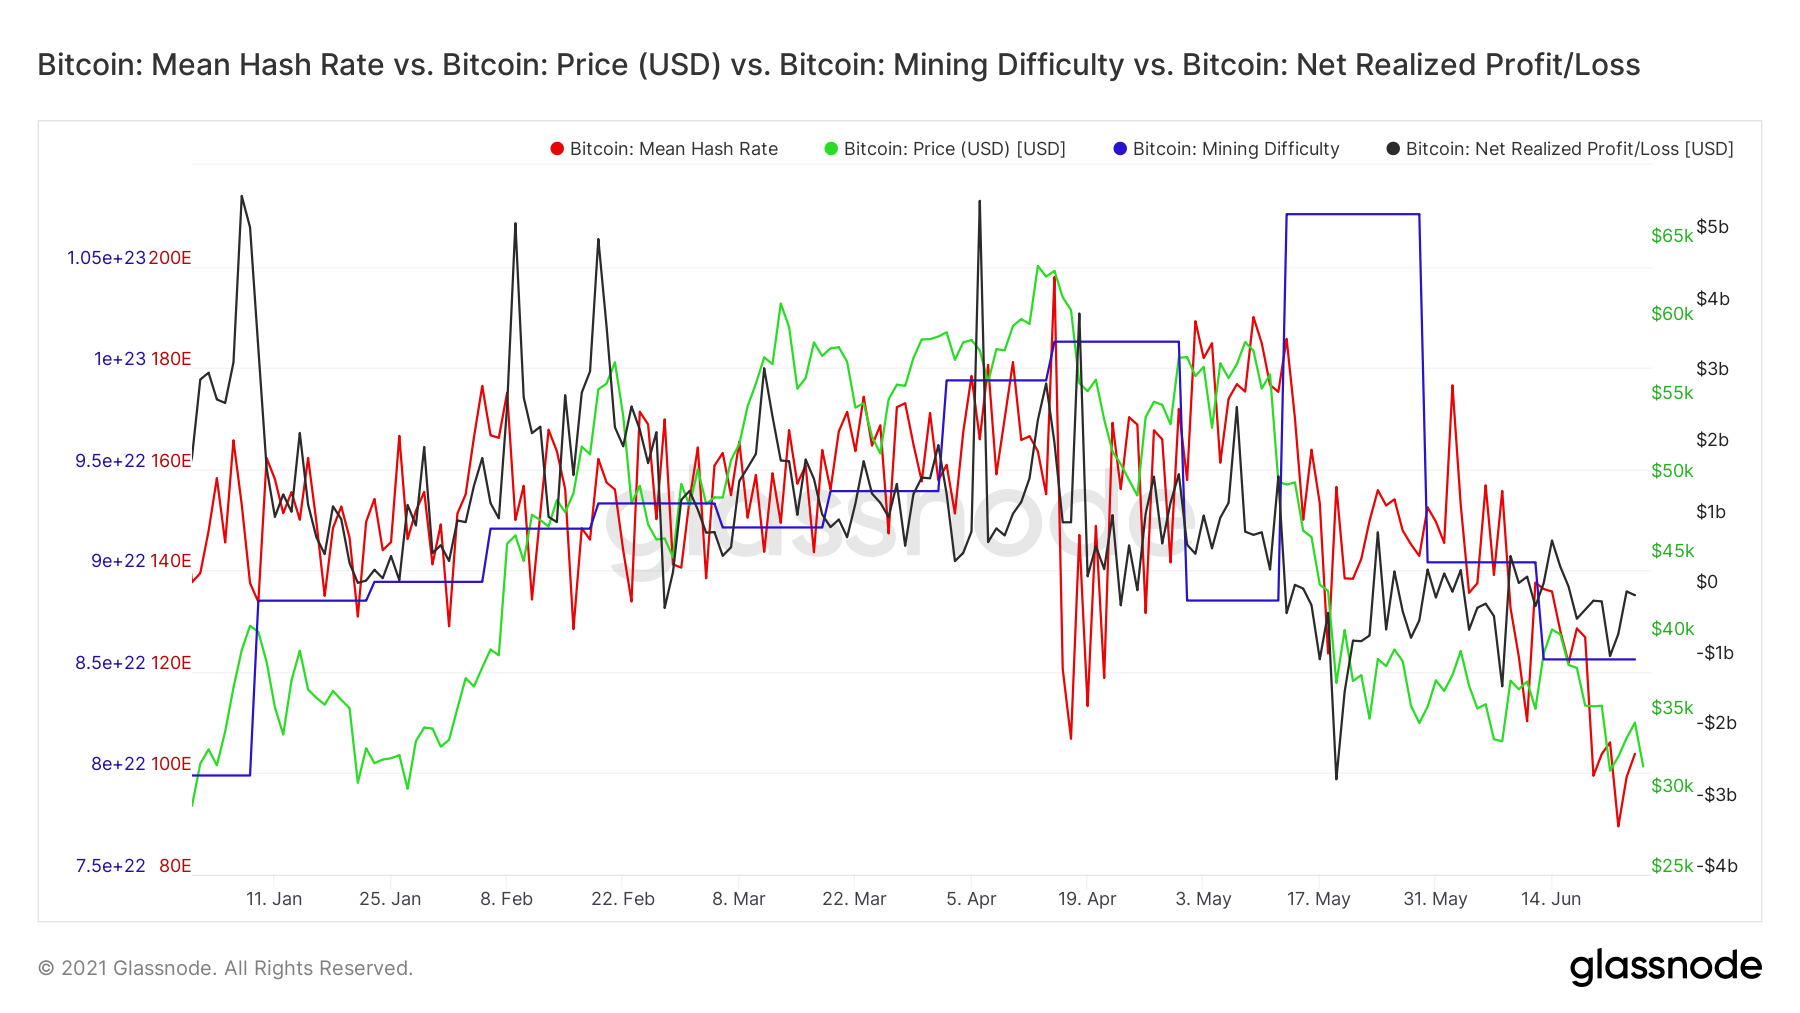
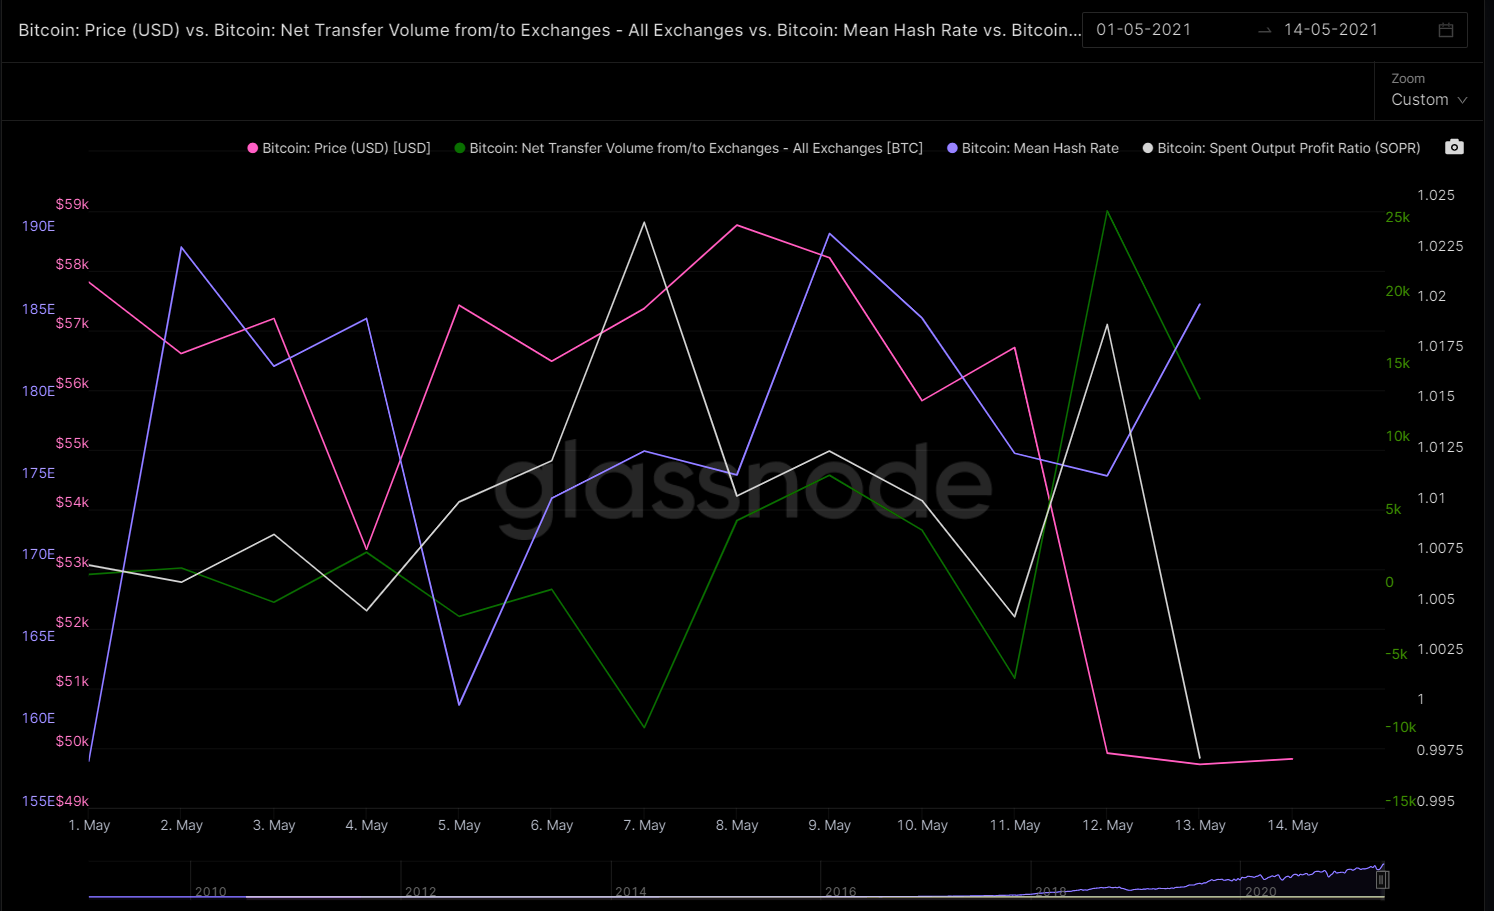
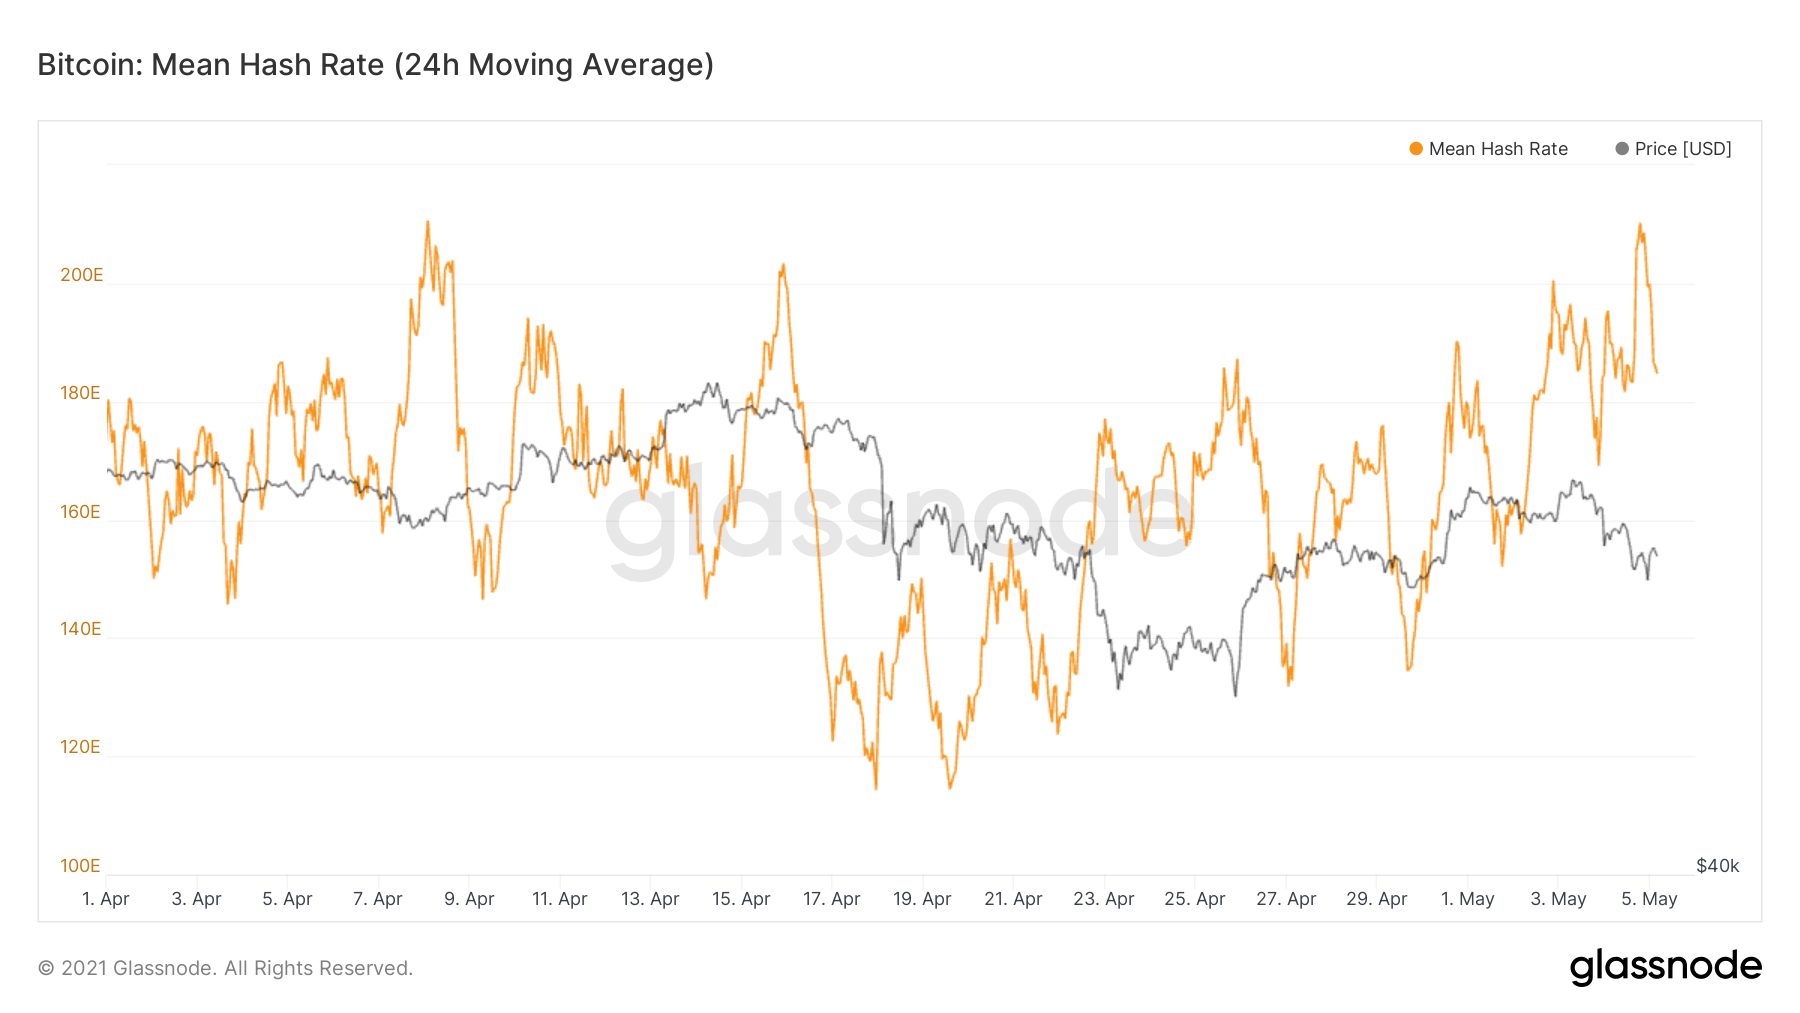
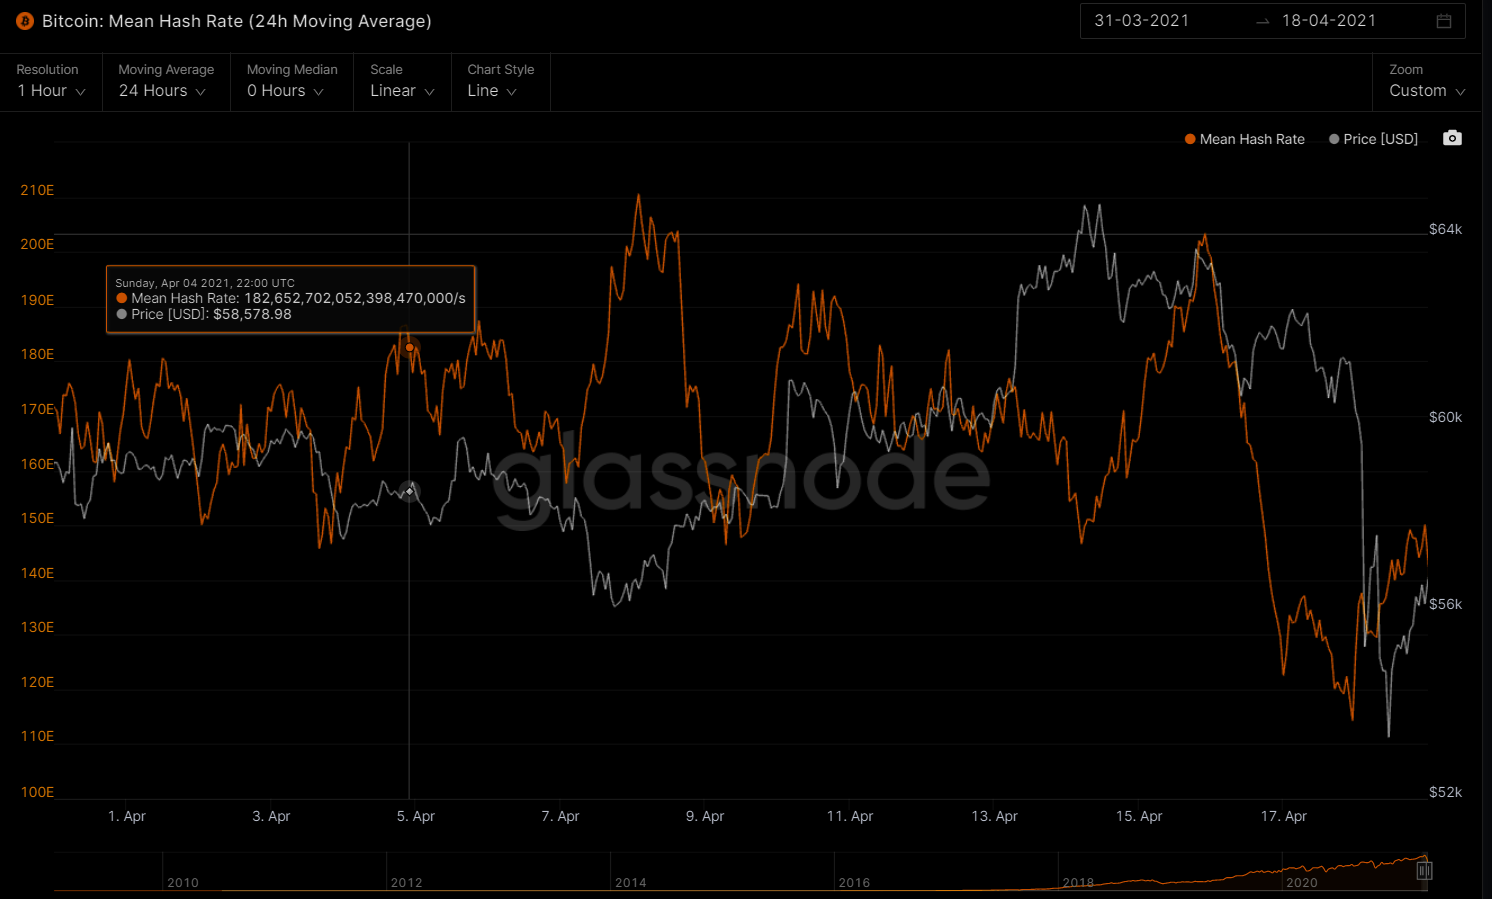
Within the metrics of the network. We always want to touch base on the Bitcoin Mean Hash Rate. Which is a core indicator of the security and compute power in the network, in this case in a Proof of Work network. The Higher the rate it means a stronger and more secure environment.

BTC MEAN HASH RATE.PNG

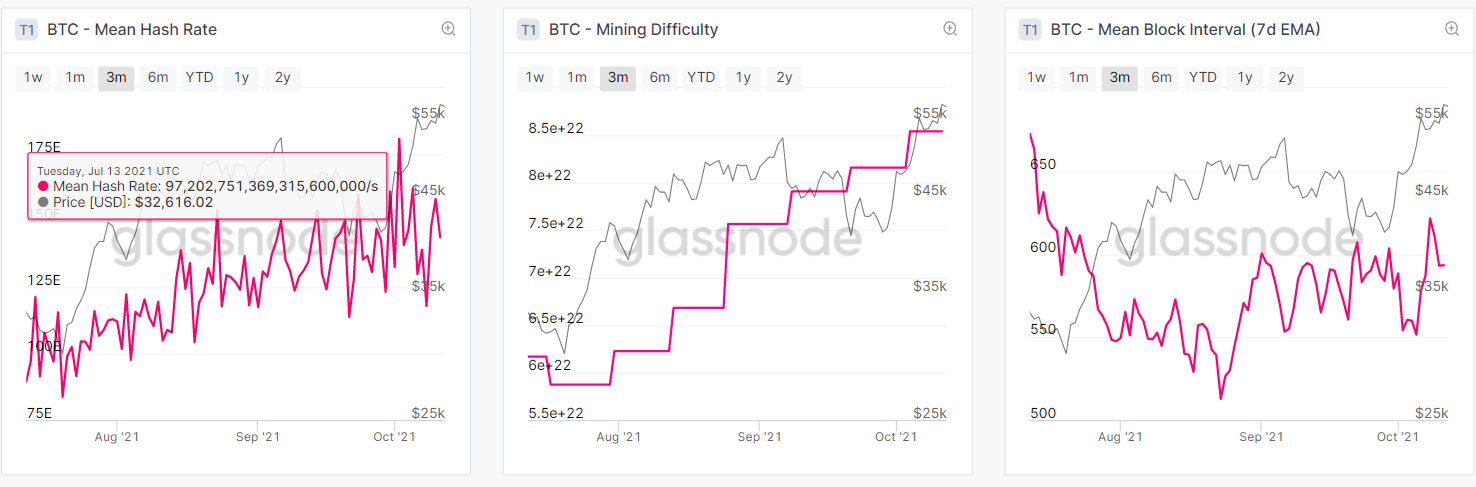
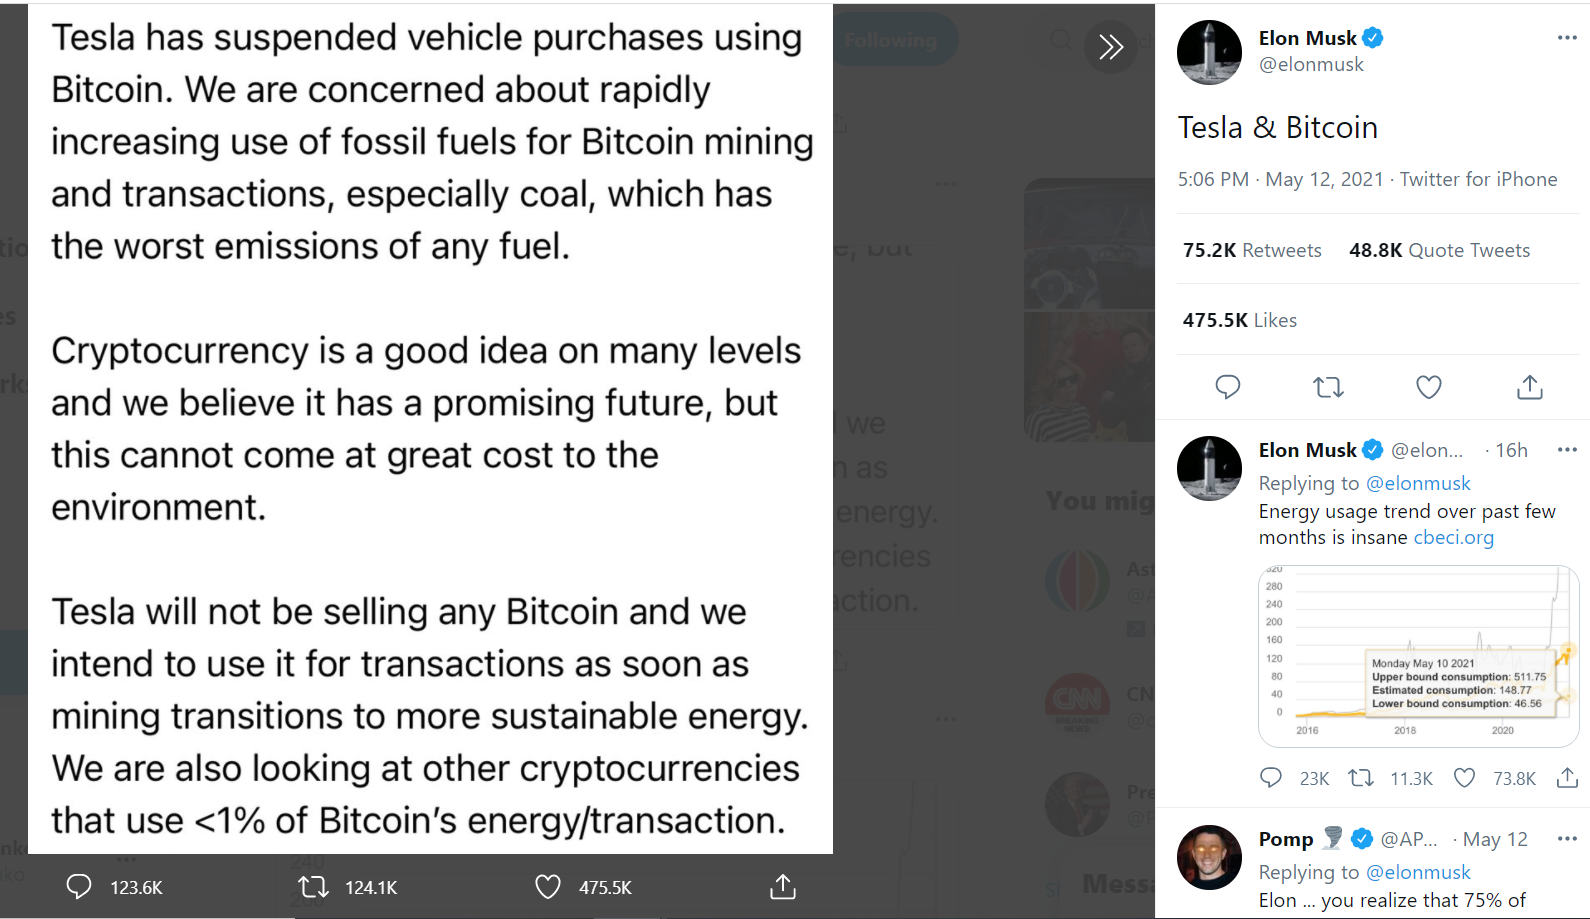
BTC mean Hash Rate is a strong indicator that helps us understand the price of Bitcoin. With the recent China Crackdown of Bitcoin Miners and several attacks in the network the Hash Rate was compromised but it has bounced back very quickly.

Bitcoin mining was greatly affected between the months of May and June when China banned Bitcoin mining. However, it now seems that mining operations have fully recovered from this ordeal and miners have gone back to earn lucrative rewards.

The Chinese crackdown on mining caused a short-term disruption in the network, and the hashrate dropped to record lows.

BTC MINING DIFFICULTY.PNG

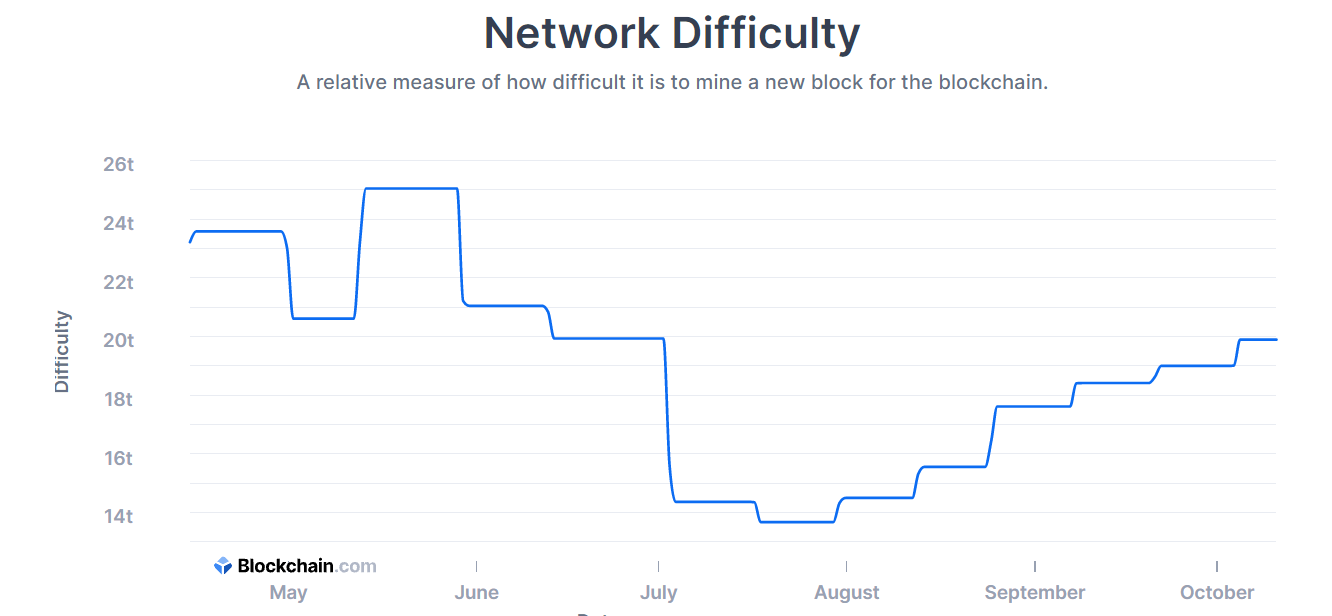
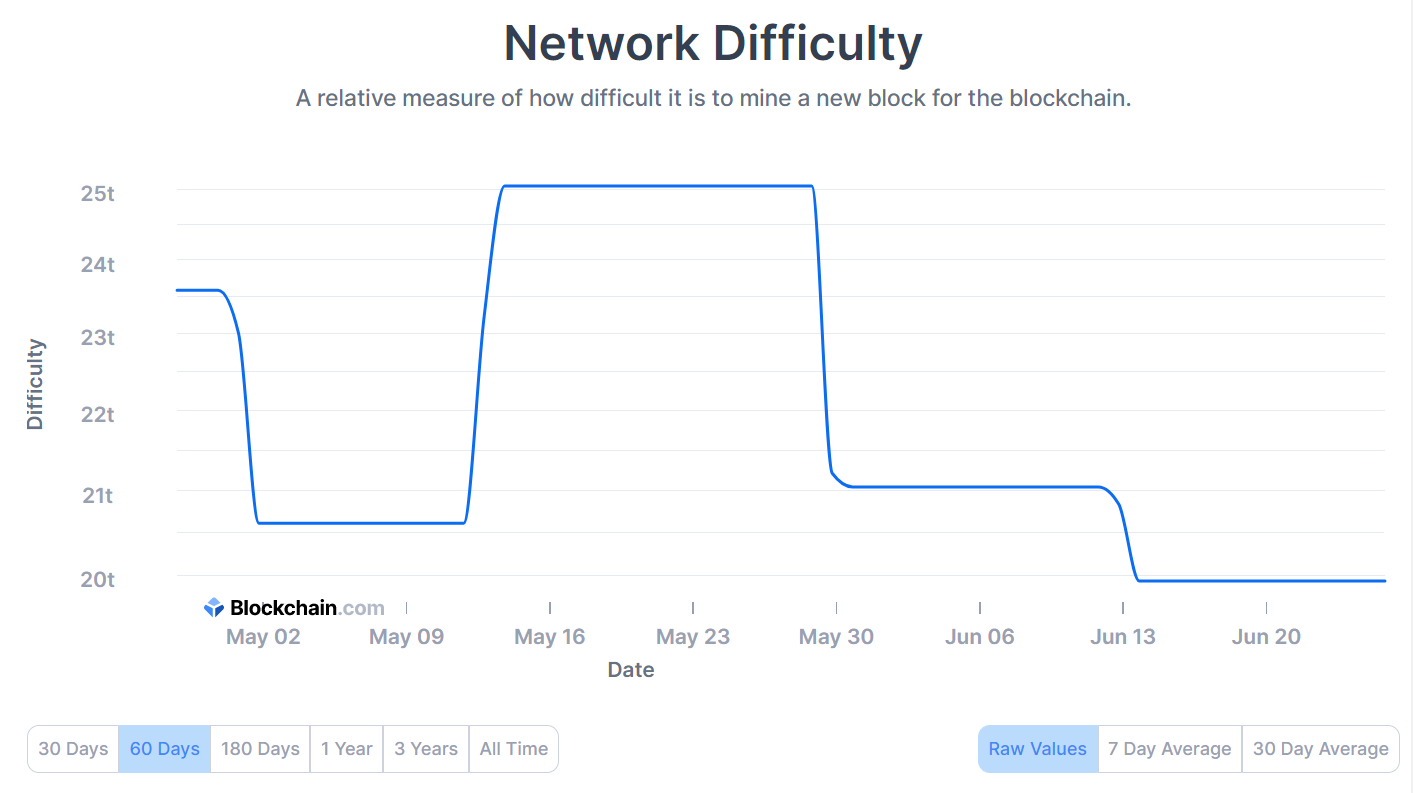
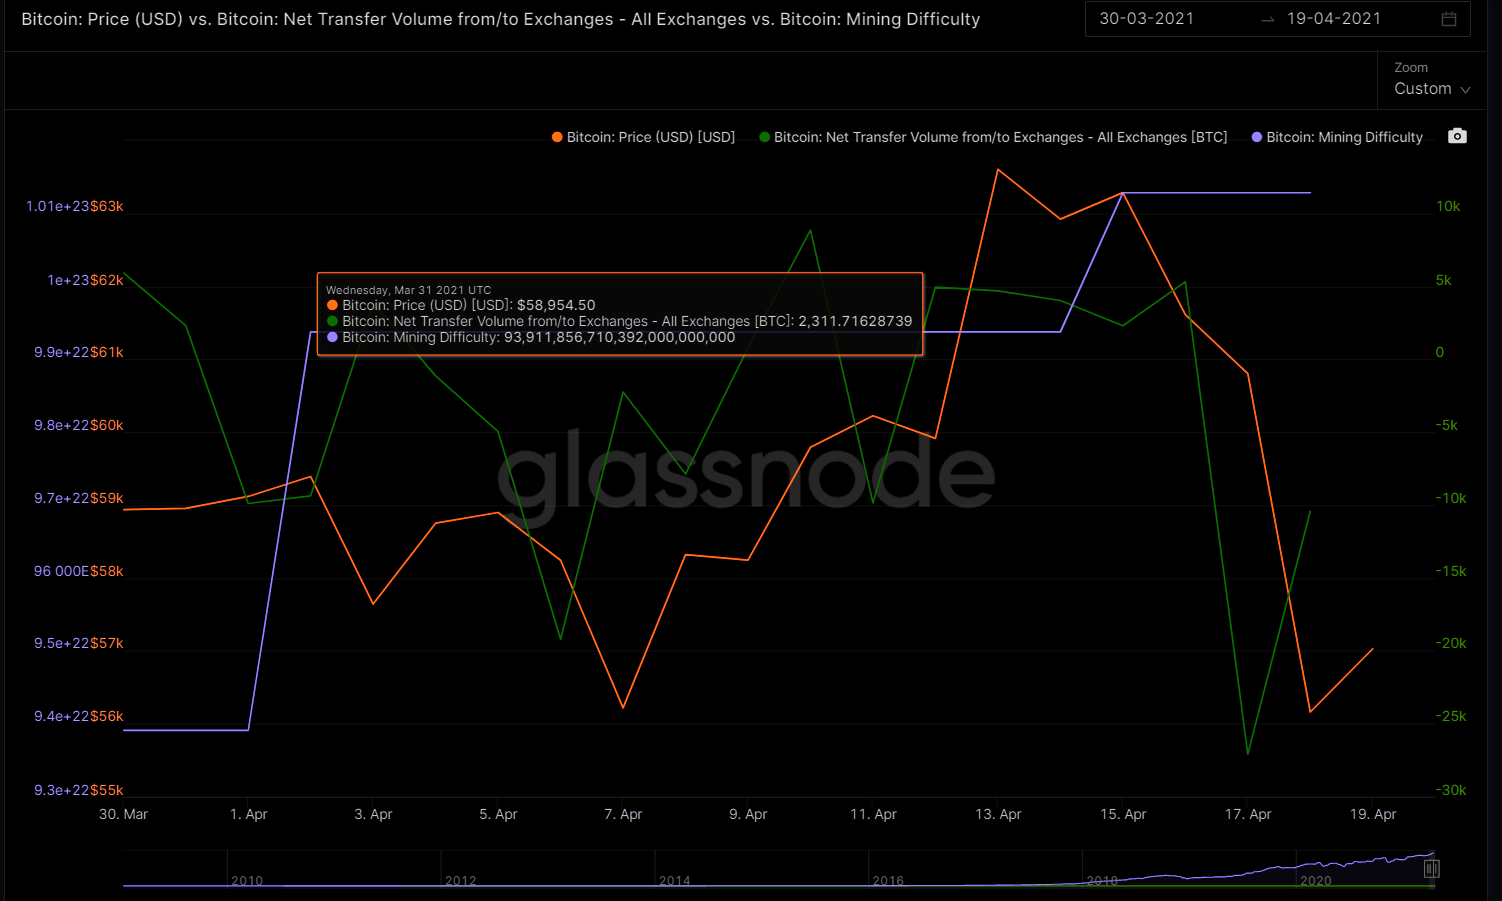
From last quarter it went up from 89 EH/s up to 180 EH/s. Backing up the strong bullish signal bitcoin price have had. Same case for the Bitcoin Mining Difficulty increasing from 14 trillion up to 19.009 trillion in October. Which also represents more compute power and more security in the network. The complexity is adjusted every 2016 blocks , which are roughly 2 weeks, meaning that the time between blocks continues to be every 10 minutes.

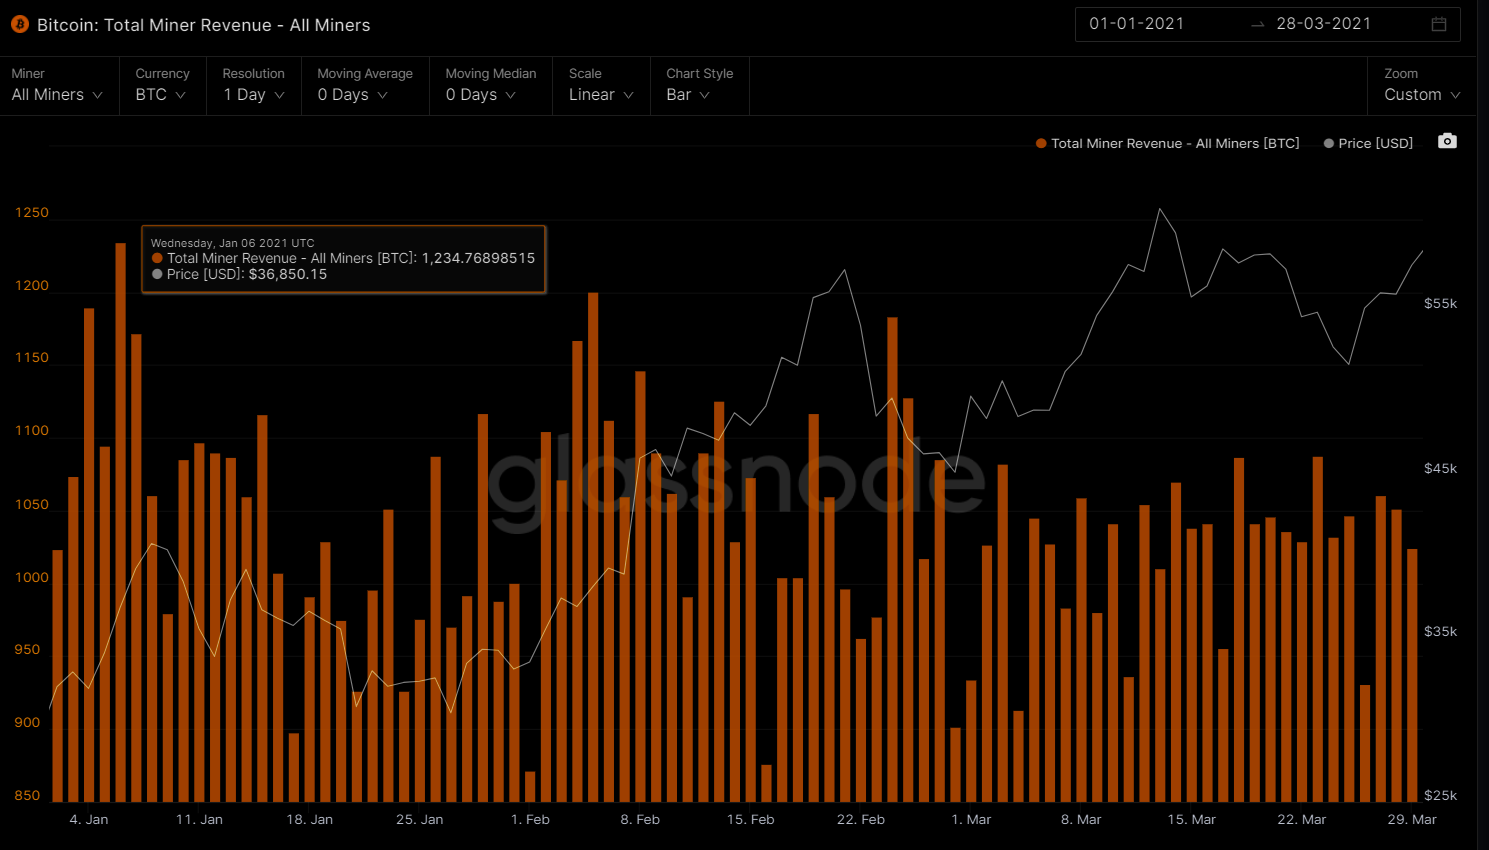
With this recovery on the Bitcoin network and with the high levels on the Bitcoin price around 57K USD at the moment, it has also increased the Bitcoin Miners.

Revenue from a total per day on June 27th of 388 BTC up to 1,245 BTC per day on August 23th and 1185 BTC per day on miners revenue on October 2nd.
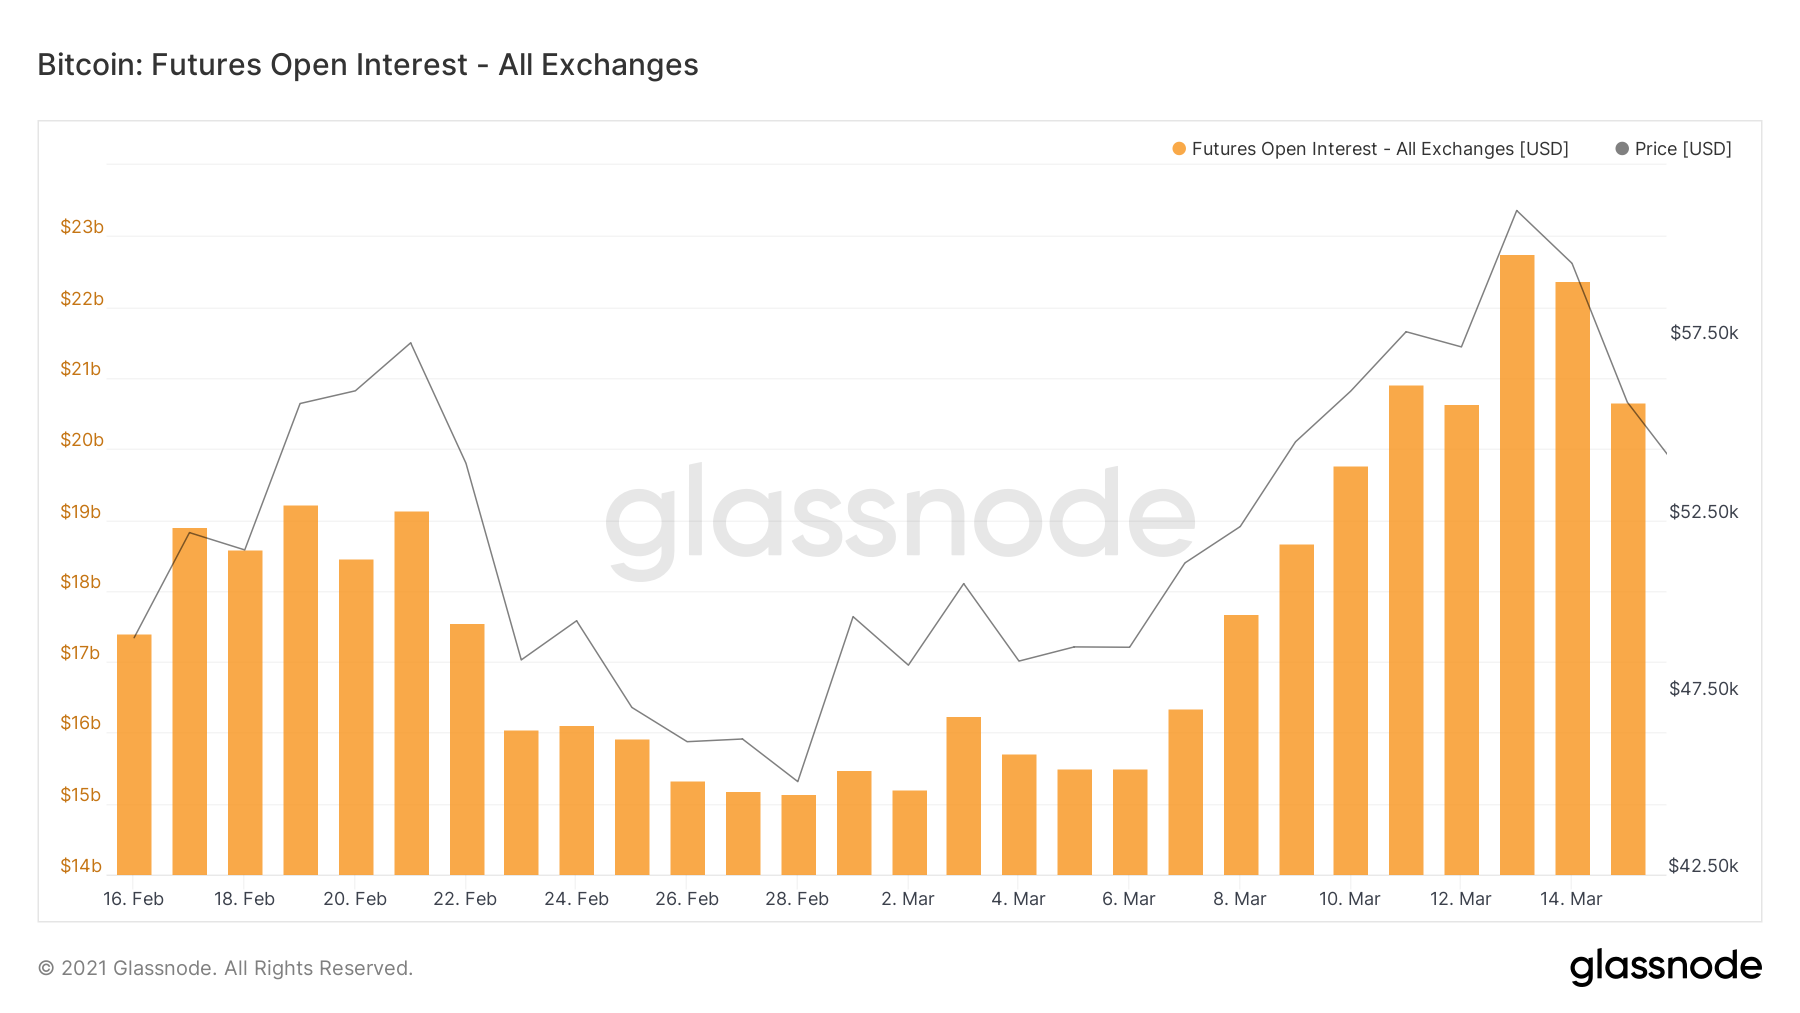
BTC DERIVATIVES

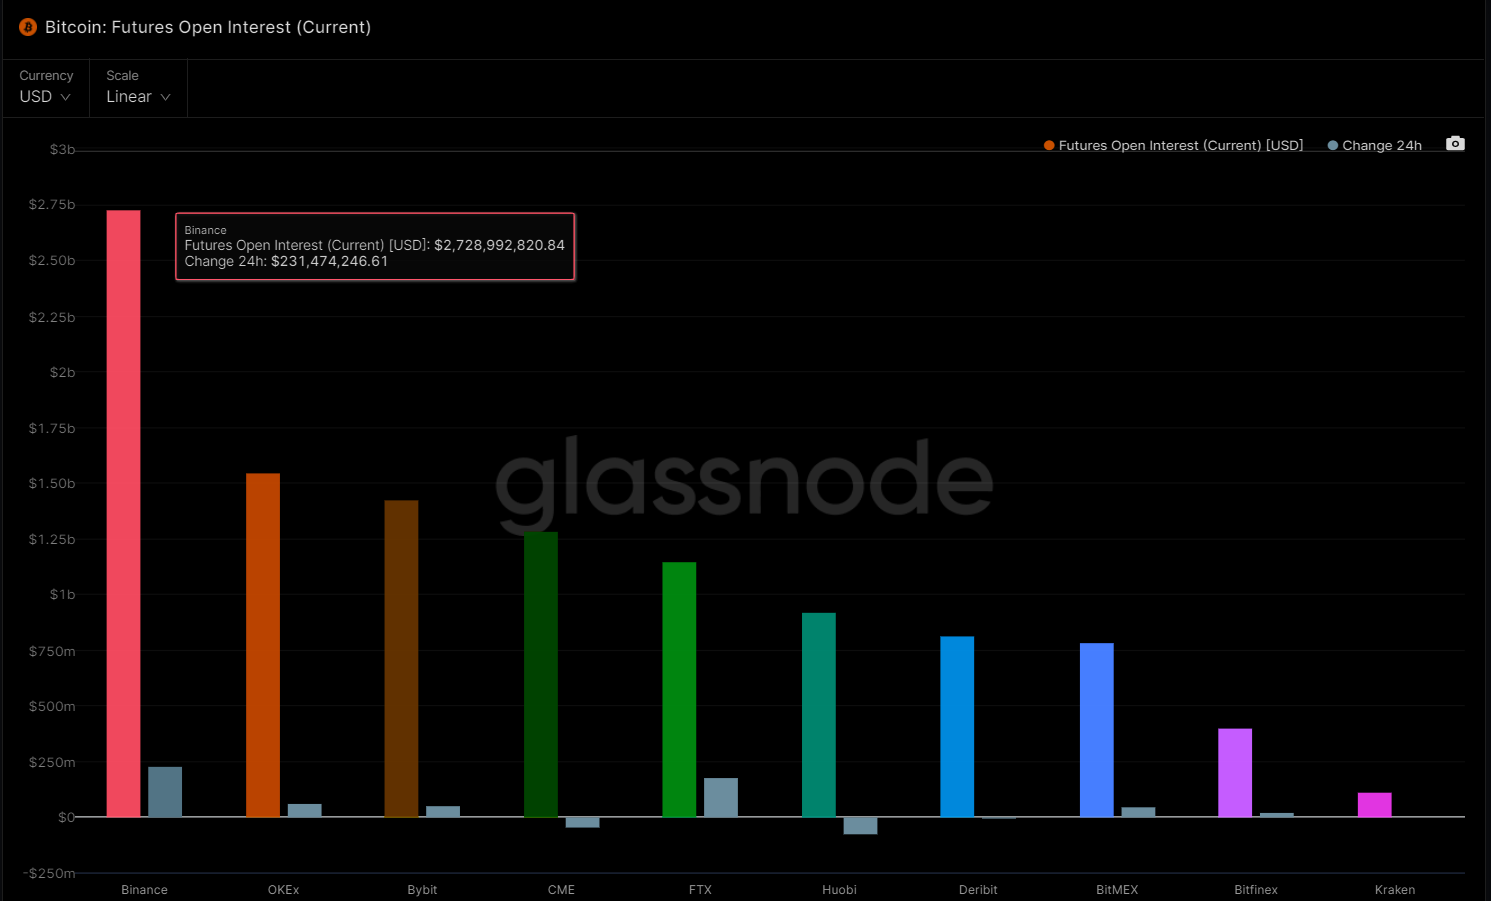
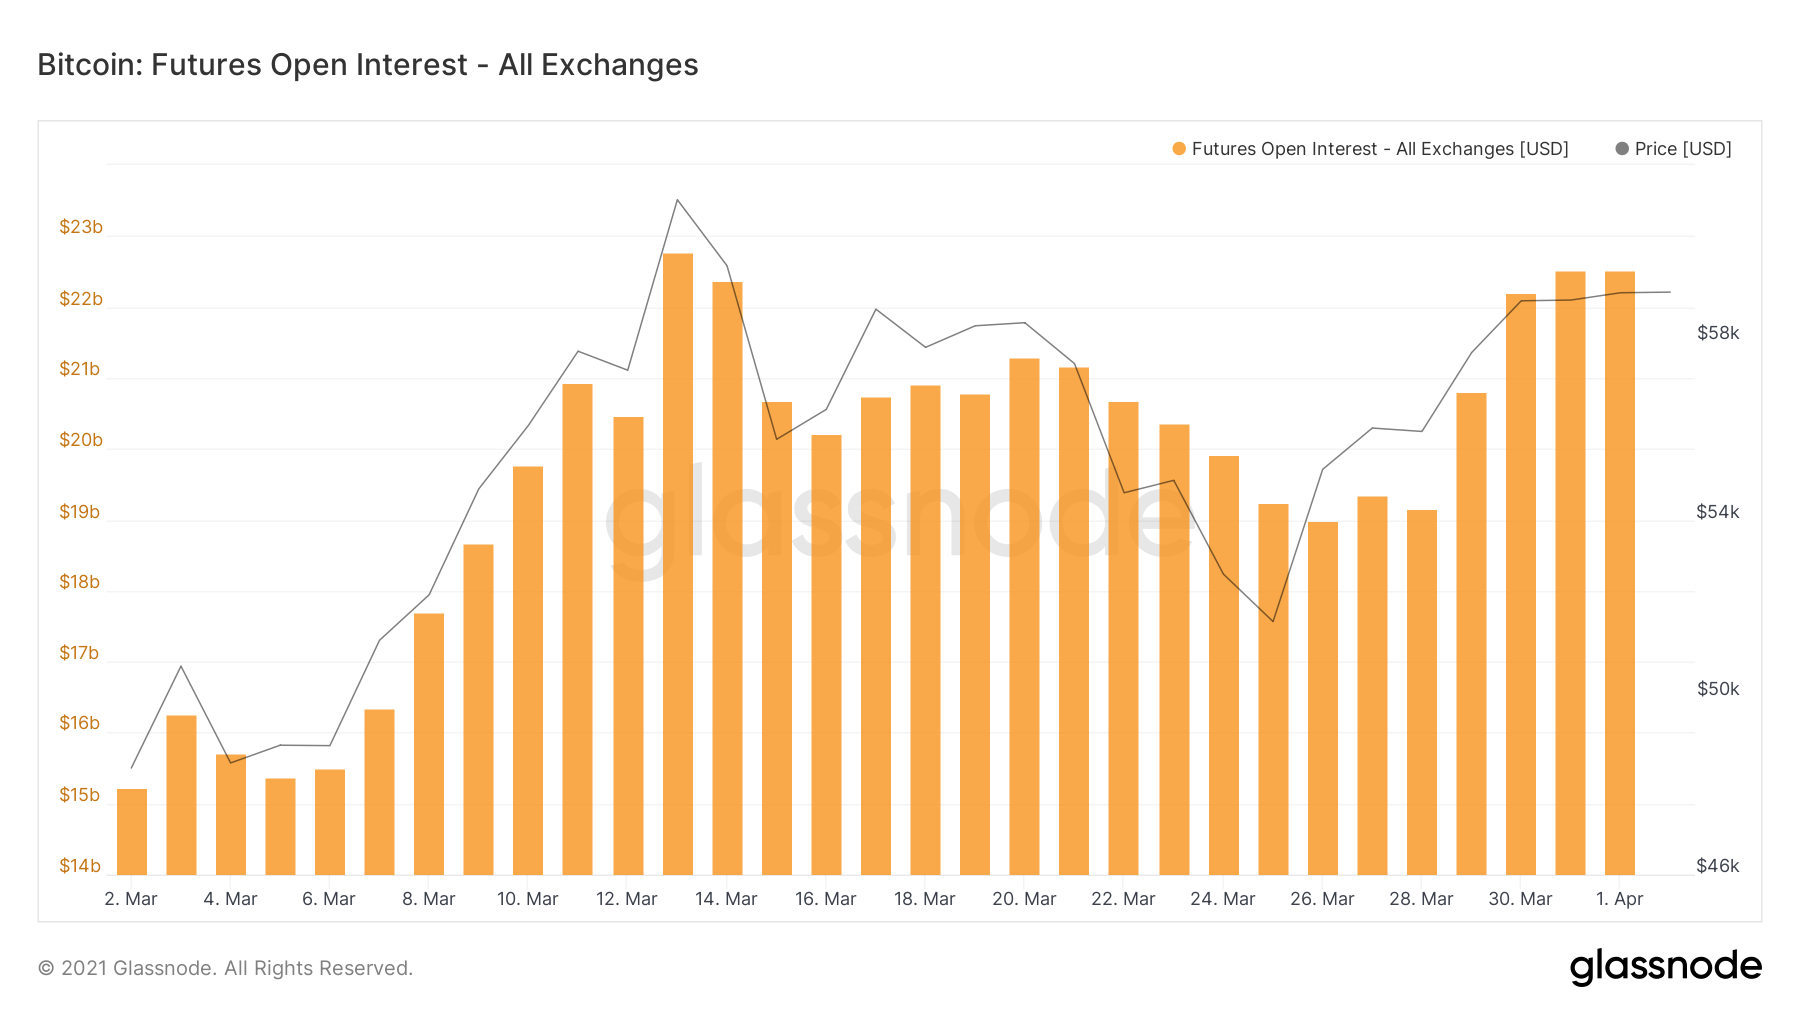
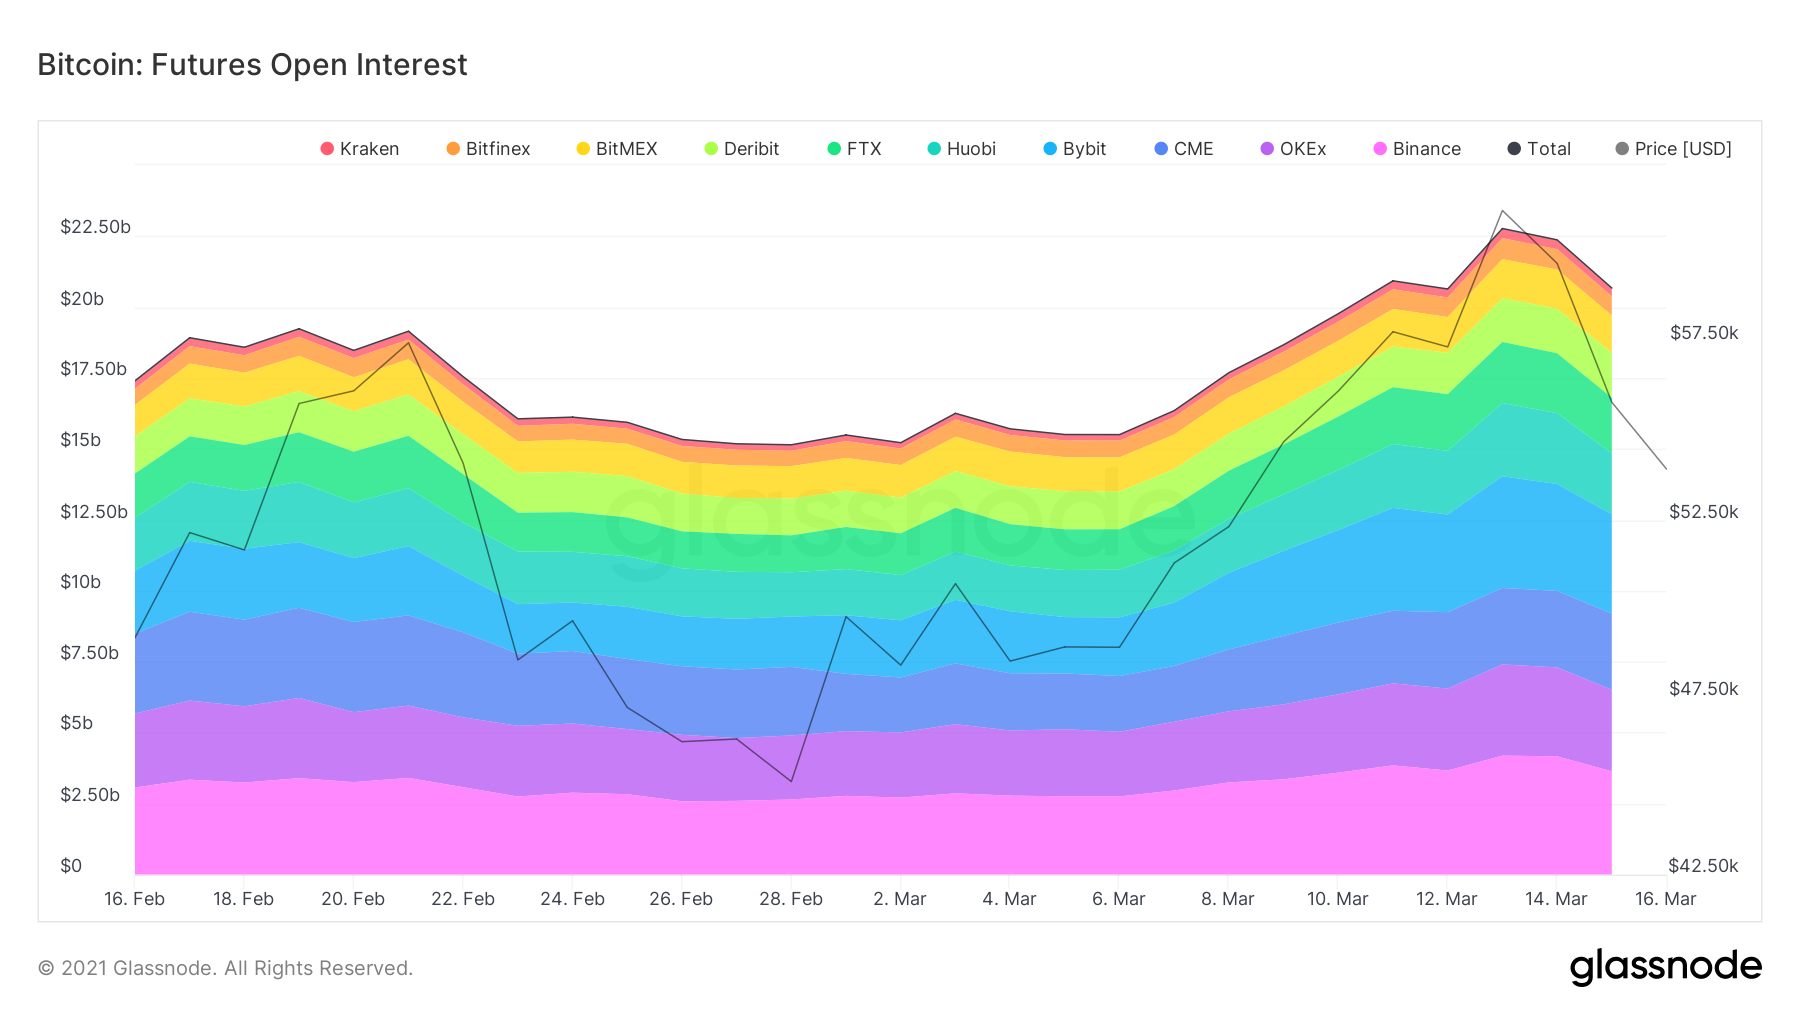
Derivatives traders are more active again, with open interest in bitcoin (BTC) futures going up significantly in recent days as BTC is testing the USD 57,000 level for the first time since May.

BTC FUTURES NEW.PNG

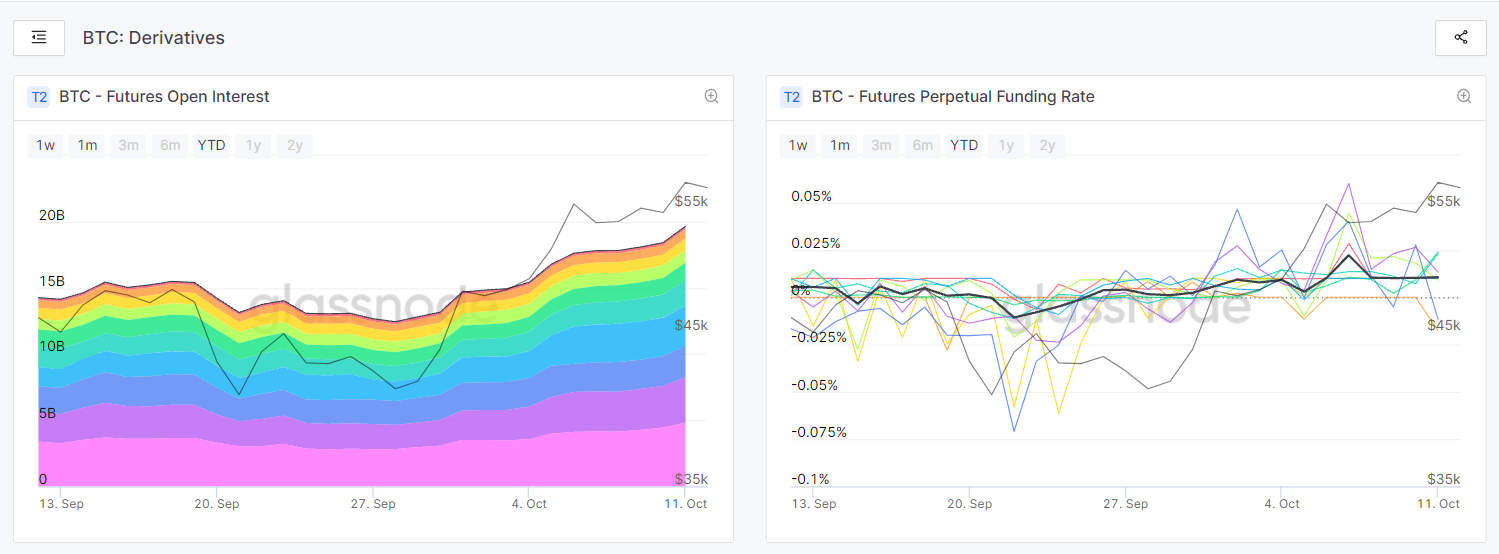
From July it has risen from 14BN USD up to 19BN USD on all exchanges. In regards to the FPFR or the Futures perpetual funding rate which is the mechanism used in order to ensure that the futures contract’s price stays close to the index or mark price. In order to stay close to the index price traders will either pay the opposite position or be paid by them. This is a way to incentivize traders to position themselves such that it drives convergence.

For example if most BTC futures contracts taken out are long, then those taking out a long will pay those shorting in order to keep BTC close to the index price.

On the contrary, if the majority of traders are taking short positions, they will pay traders taking a long position in order to keep BTC near the index price. These payments are automatically executed (taken or added to the trader’s margin) every 8 hours.

When observing the current rate for September, we can note that, most of the month has been a positive funding rate. (showing a strong bullish sentiment)

When looking at exchange analysis we can utilise the funding rate in order to see the general positions / sentiment of traders. We can then come to the following conclusion:

  • If the funding rate is positive – users are typically taking long positions and traders are overall bullish.
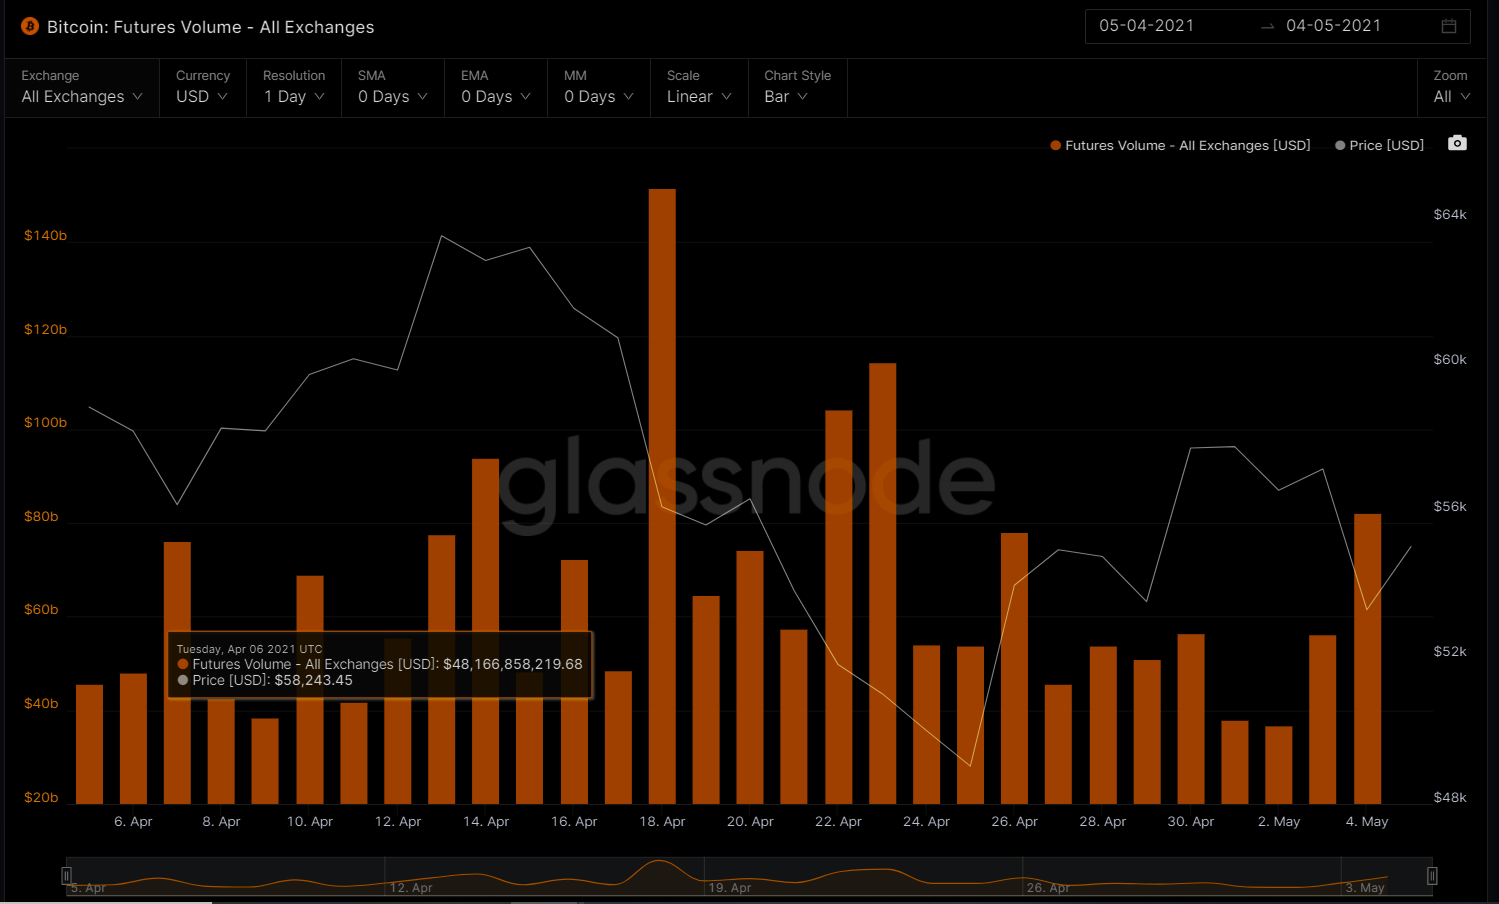
BTC FUTURES VOLUME

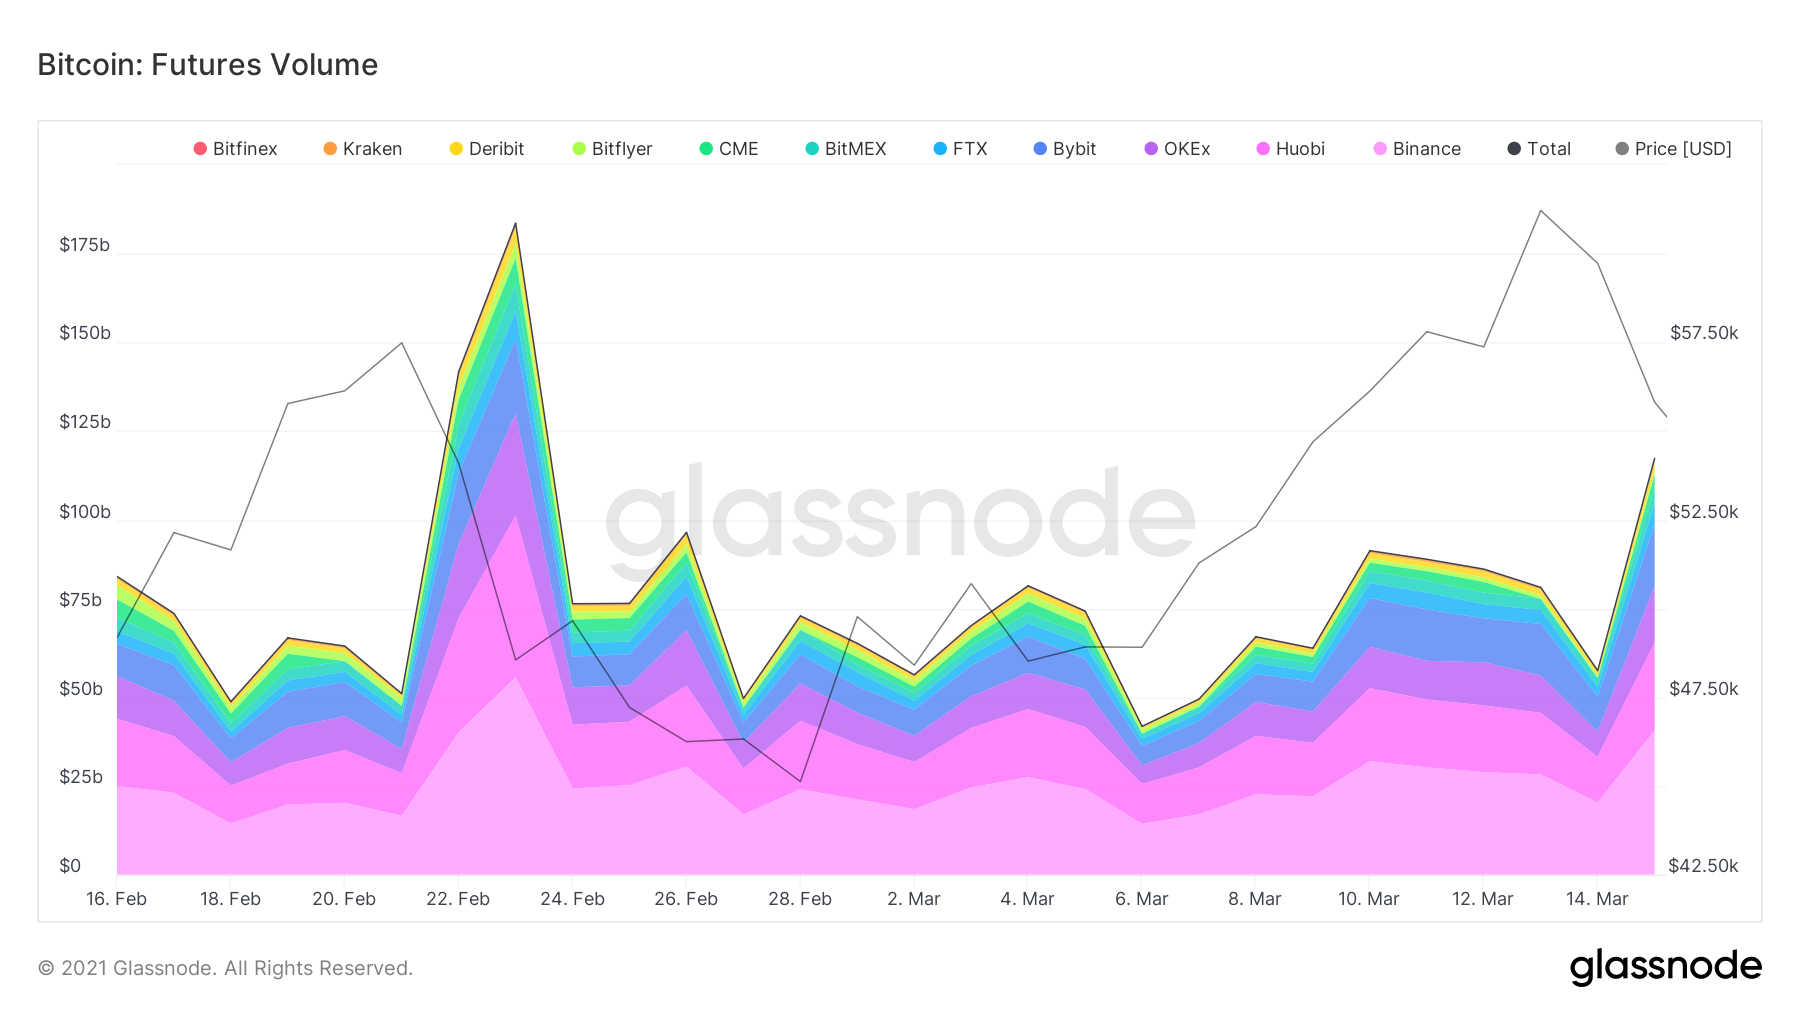
In regards to the total volume (USD) traded in future contracts per exchange over the last 24 hours.

We can observe Binance continues to be the leader with a volume of 32.3 BN USD, followed by OKEX with a volume of 9.4 BN USD then ByBit exchange with 8.4 BN USD. Both FTX and Huobi with a volume average on 5.5 BN USD and finalizing with CME with 2.4 BN USD and Bitmex with 1.9 BN USD repectively.

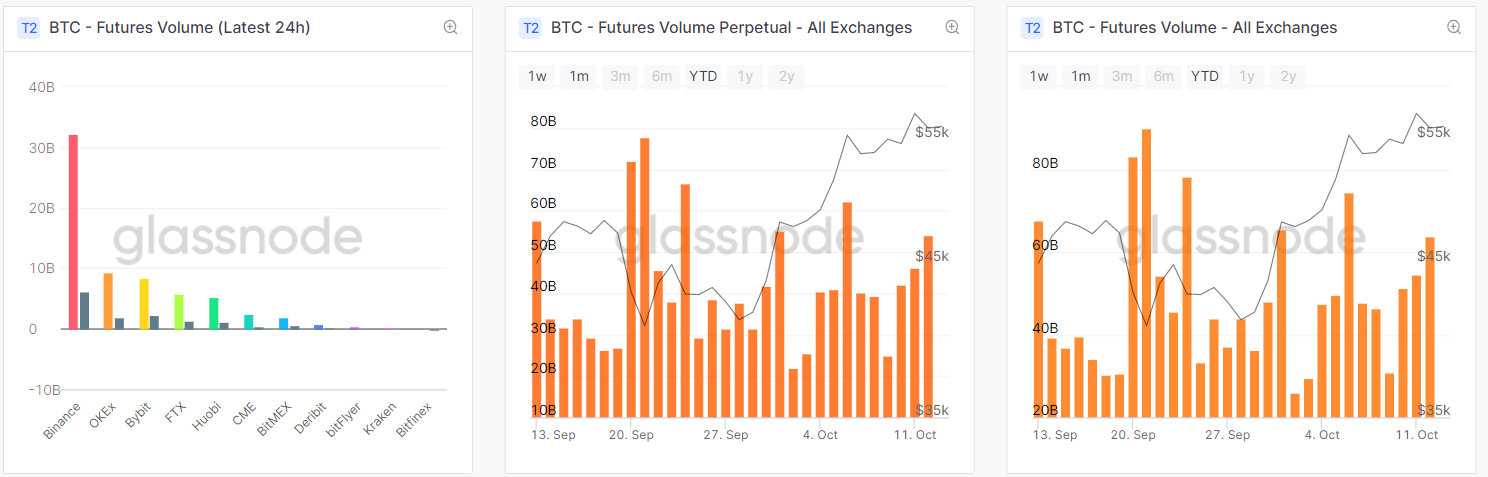
Both Future Volumes and Perpetual had a huge increase by mid September when they reached their highest level. 77 BN USD for Perpetual and 89 BN USD for Future Volumes.

So observing both the perpetual funding rate and the volumes we can confirm the bullish trend we have seen during September 2021 and continuing in October.

FUTURE LONG & SHORT POSITIONS LIQUIDATION

When observing the liquidations on the market for both Future Long positions and Short. There were a total of 163 MM USD Long positions liquidated on September 20th led by Bitmex with 80MM USD liquidations, OKEX with 52 MM USD and Binance Exchange with 29MM USD.

LONG-SHORT POSITIONS.PNG

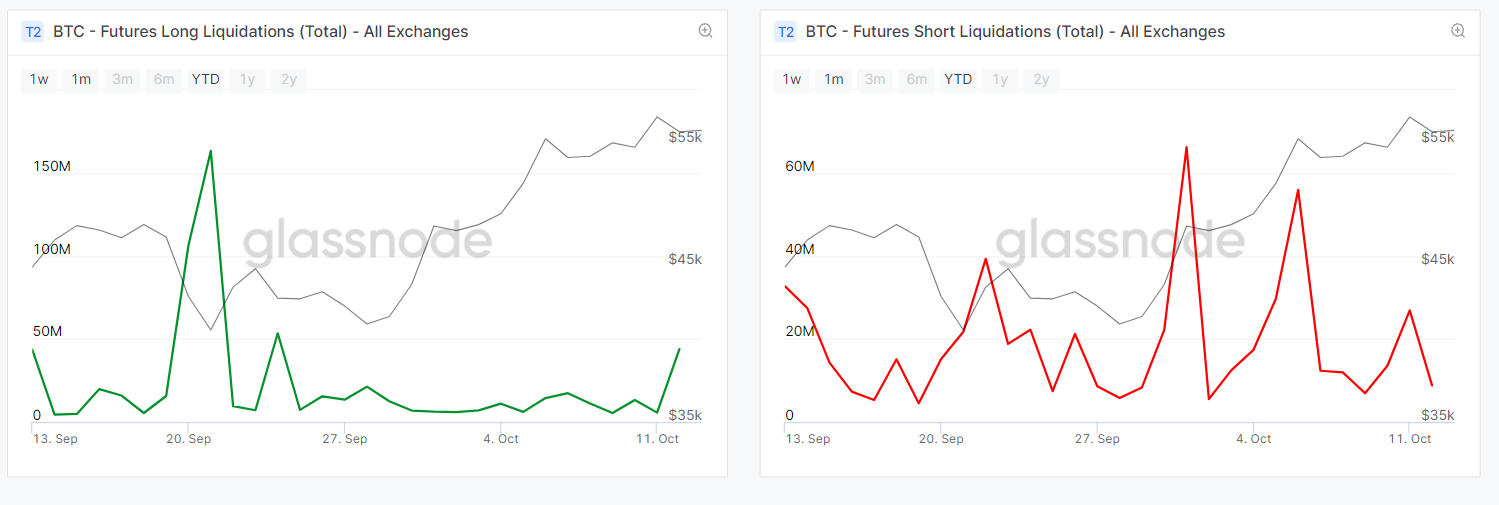
Same case ocurred with the short liquidations when in October 1st there were a total of 66 MM USD accross Binance (16MM USD) , BITMEX ( 34MM USD) and OKEX (15MM USD) respectively. And on October 6th with a total of 55MM USD with Binance with 17MM USD , BITMEX (10MM USD) and OKEX with 27MM USD.
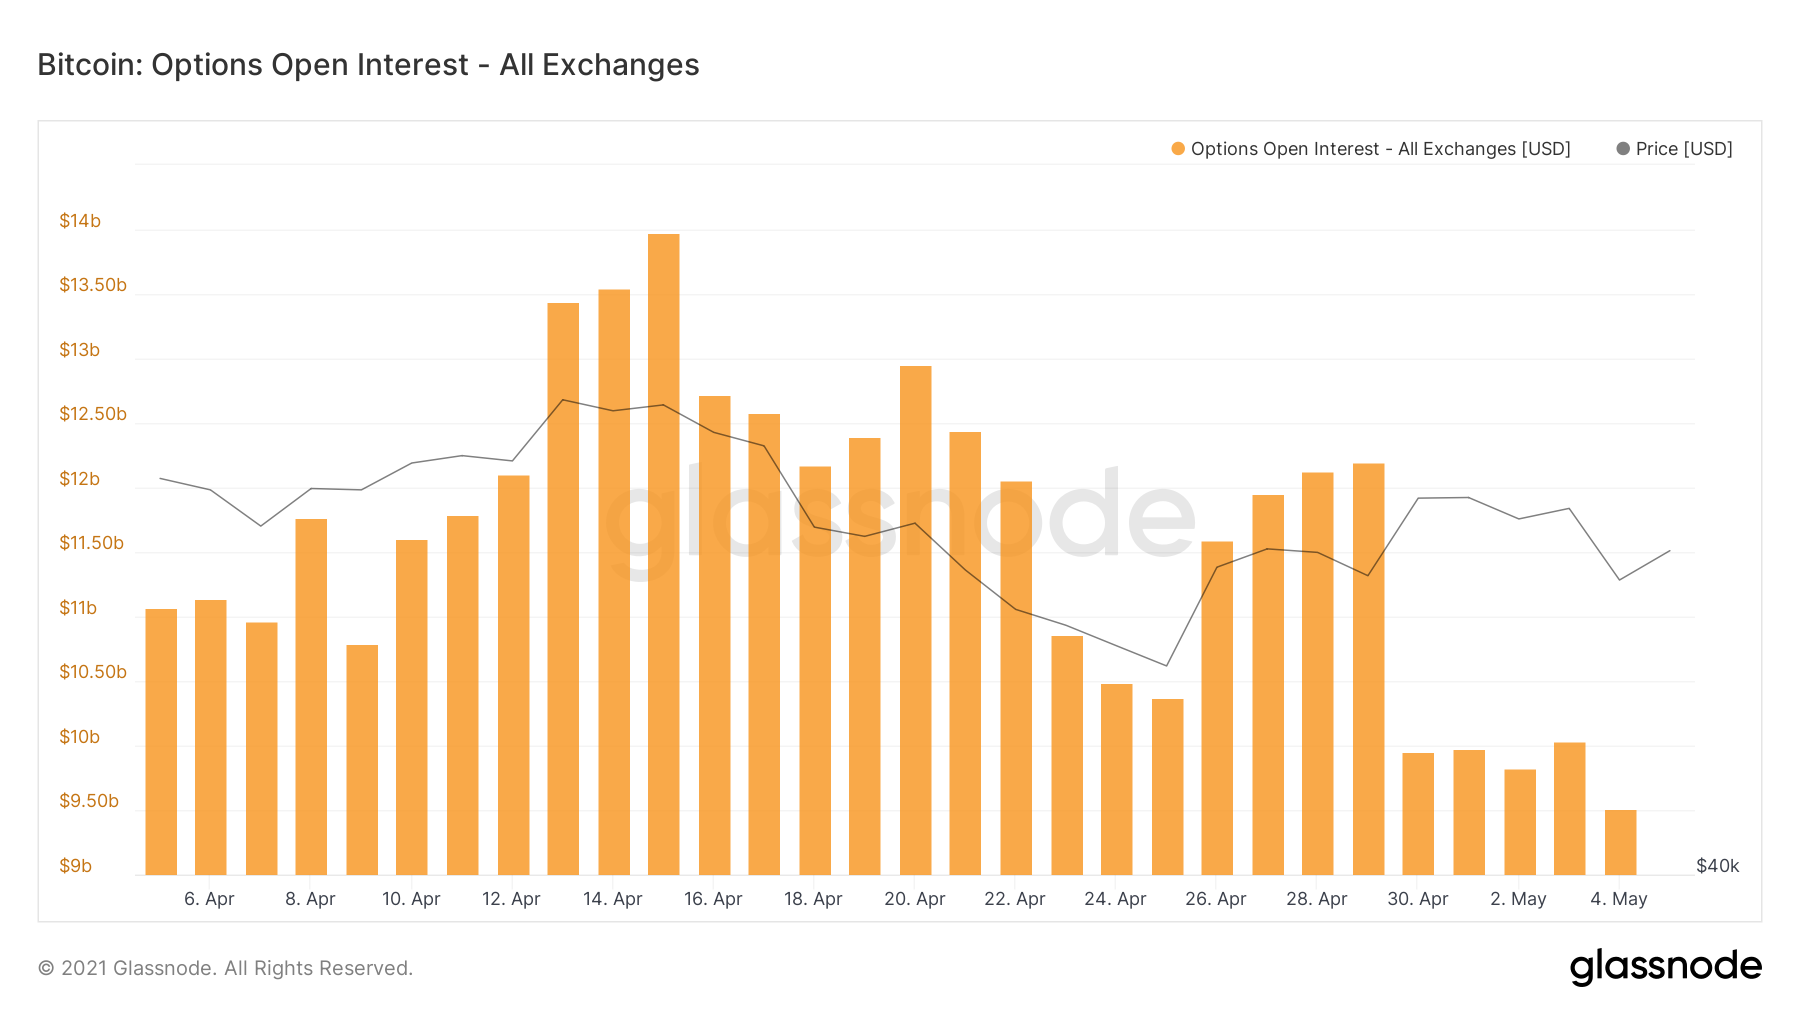
BTC OPTIONS

BTC Options are derivative instruments that give the purchaser the right to buy or sell the underlying asset at a predetermined price on or before a specific date. A call option gives the holder the right to buy, while the put buyer gets the right to sell. Open interest refers to a number of calls and put option contracts traded but not squared off with an offsetting position. A call buyer is implicitly bullish on the market, while a put buyer is bearish.

OPTIONS.PNG

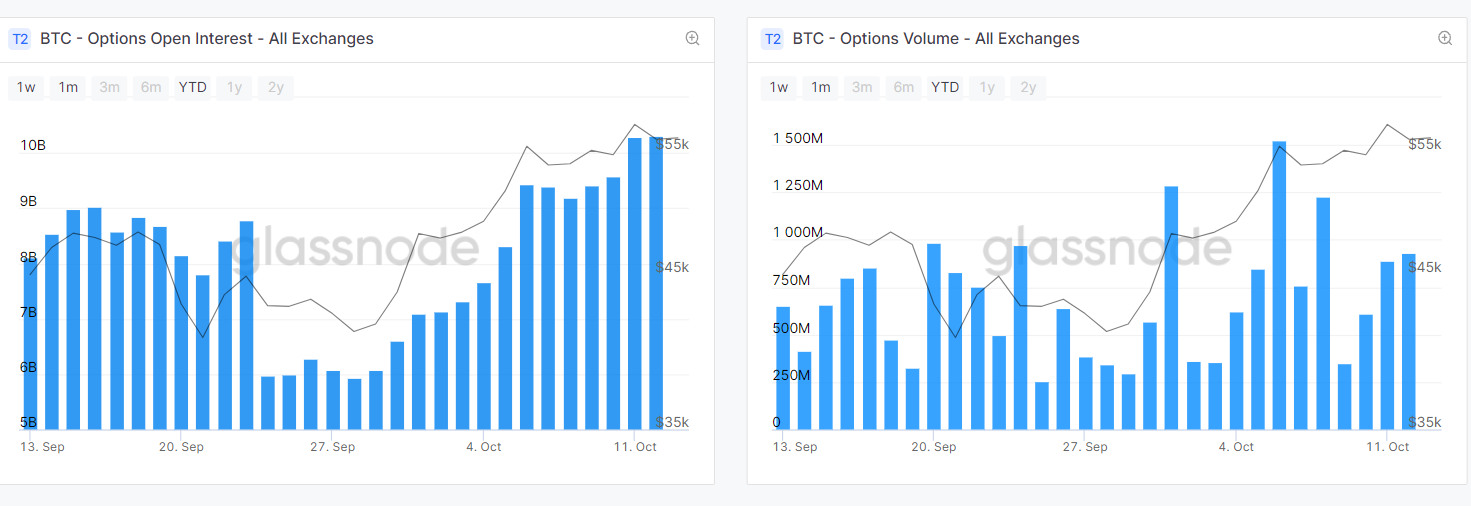
During September open interest on all exchanges was in the range of 8.1 BN USD and going up to 10BN USD during the first week of October.

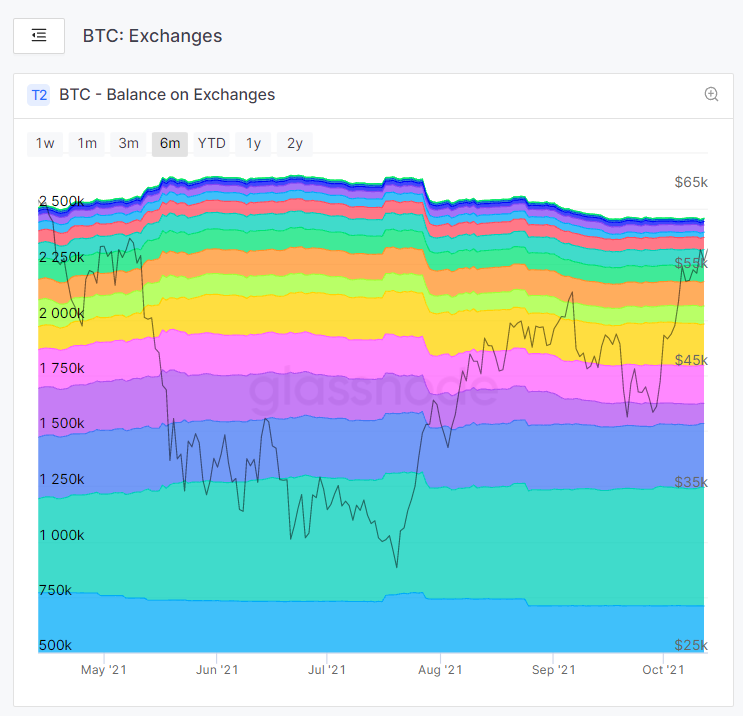
NET TRANSFER VOLUME FROM / TO EXCHANGES

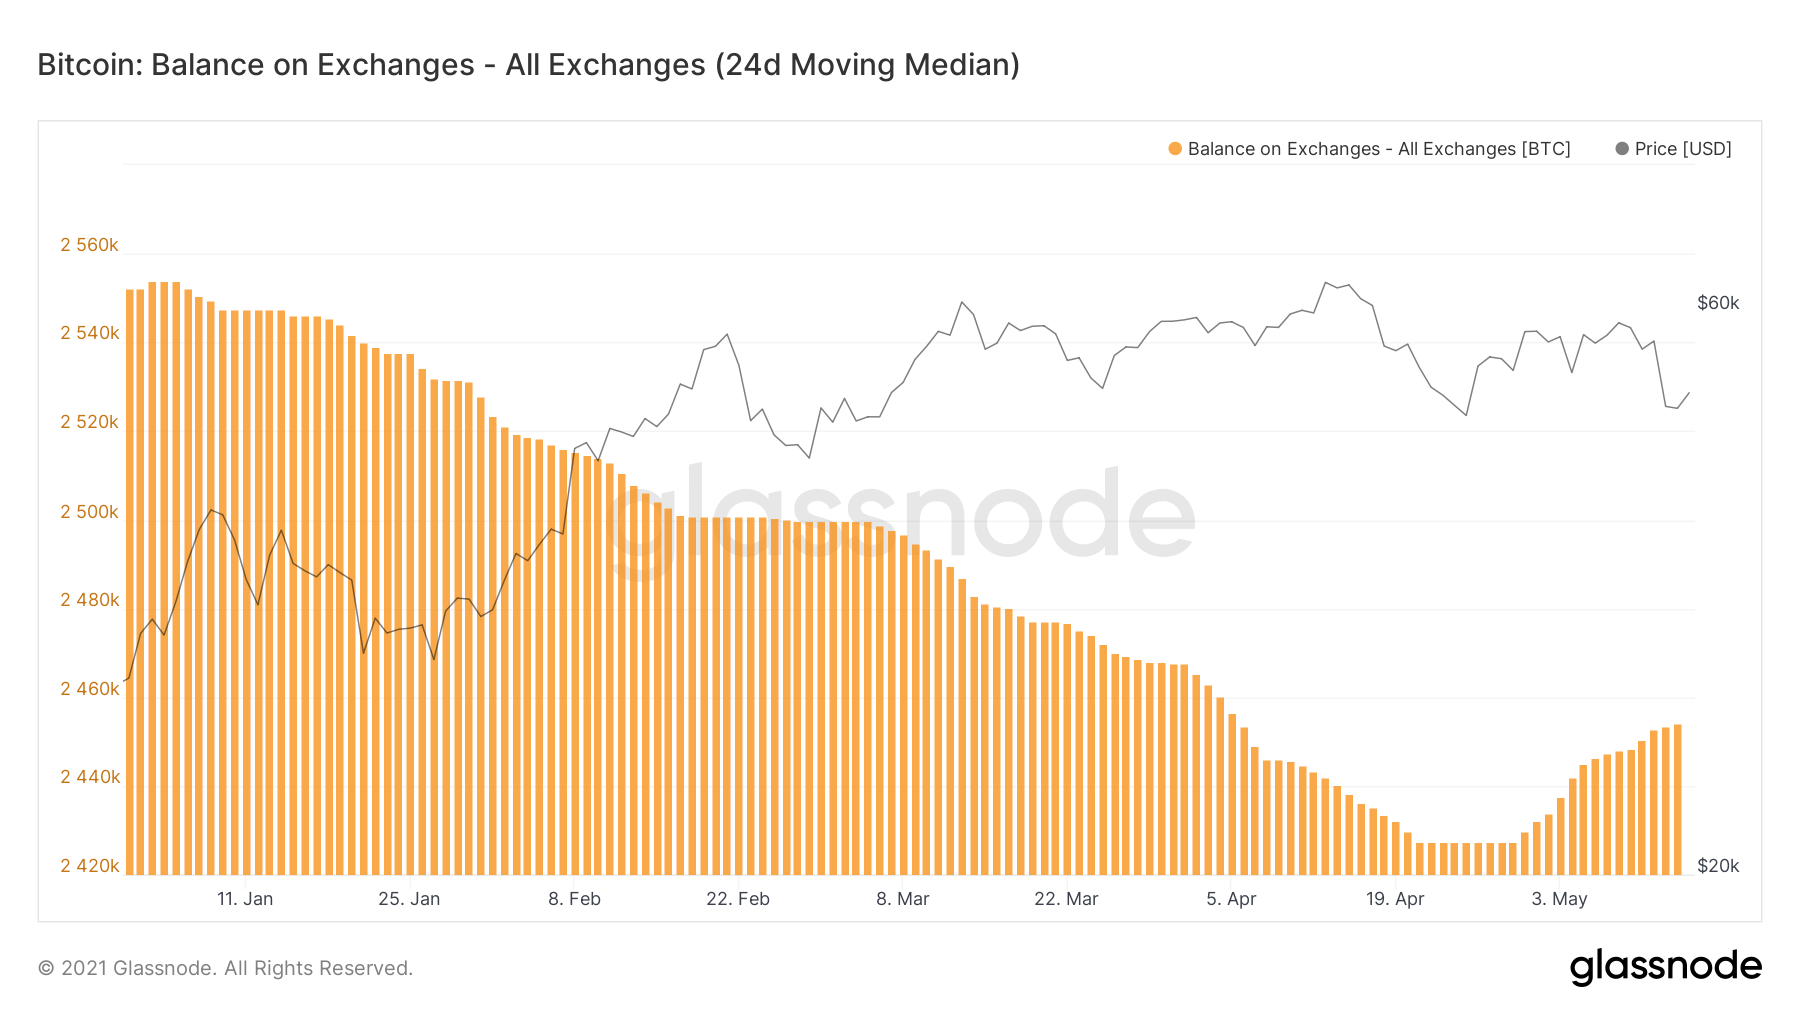
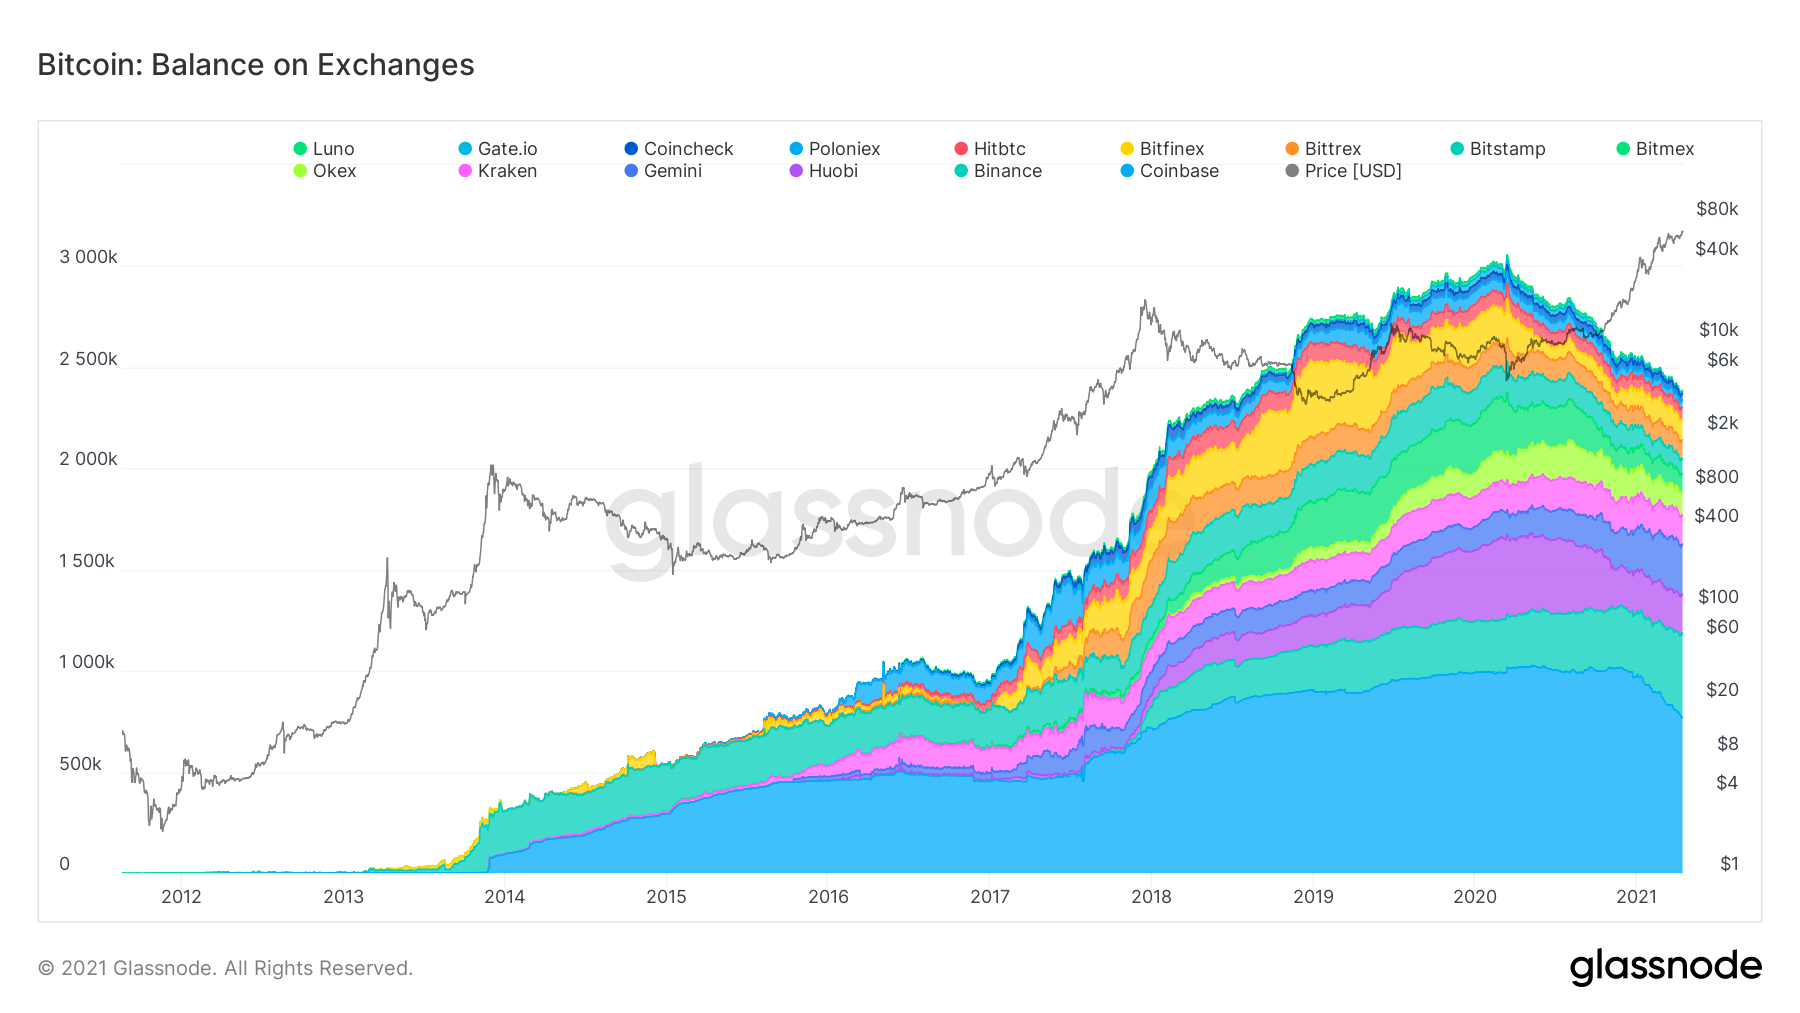
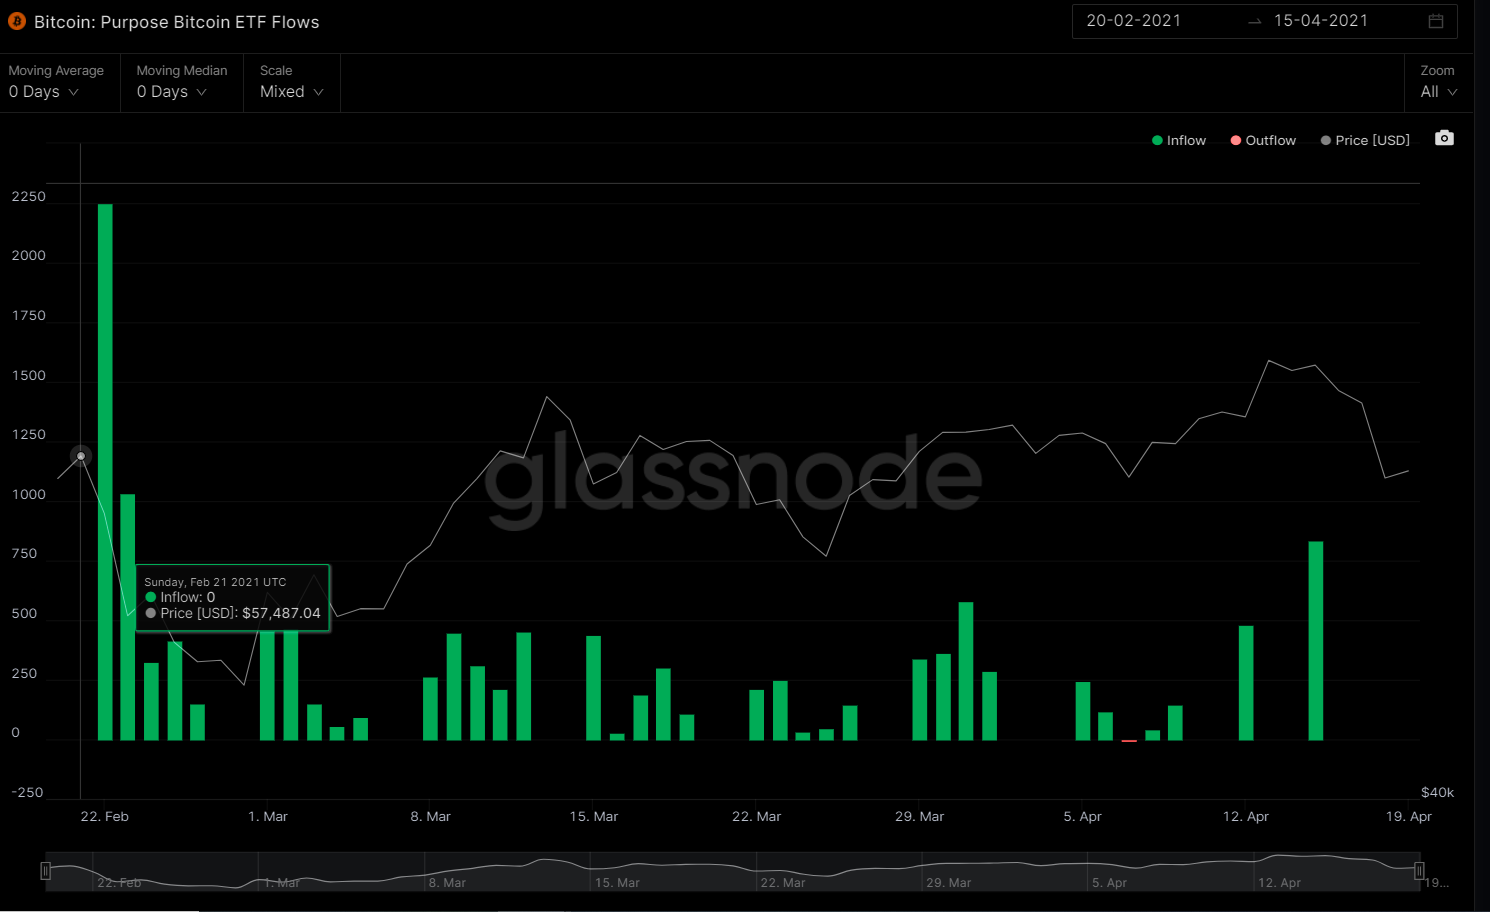
During Q2 2021 we can note that the volume on exchanges was positive from May to the end of June with balances fluctuating to exchanges from 724 BTC in April 2021 to a high inflow on May of 3,628 BTC. After that period we can observed how it decreased the inflows to almost 230 BTC by the end of June before going negative the net volume.

During Q3, the inflows have been mostly negative having the lowest point in August with almost -983 BTC flowing out from exchanges which got almost compesanted by an inflow of up to 1,206 BTC on August 30th. During the month of September that inflow from August was rapidly erased by the big outflow of -2,405 BTC on September 28th.

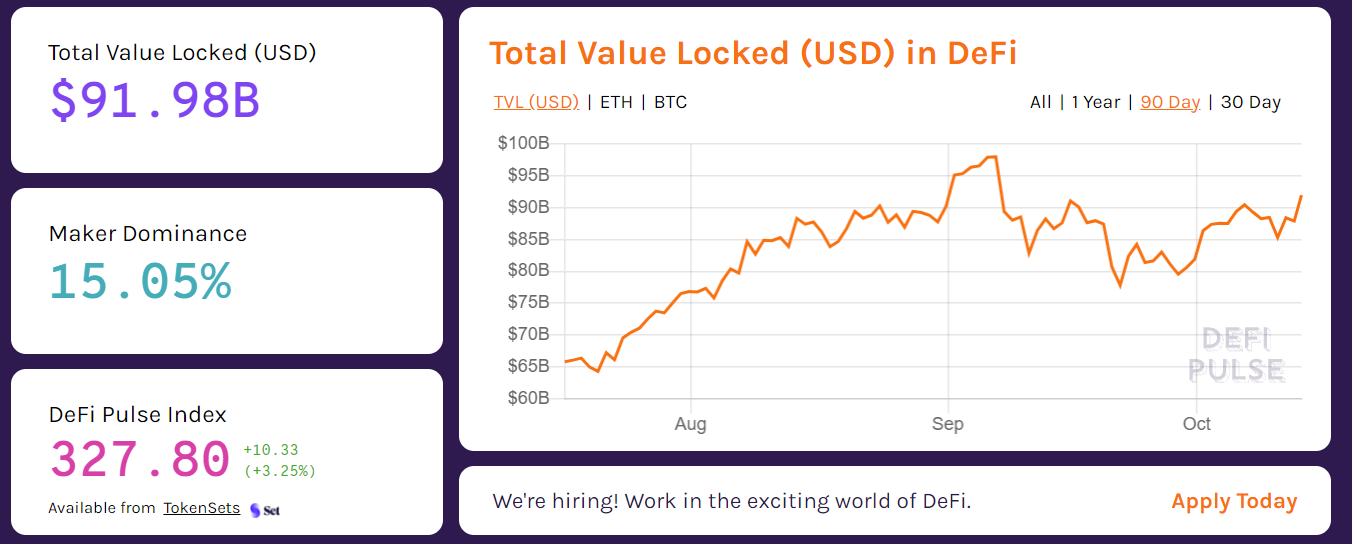
We can interpret the same trend of outflows from exchanges as the following:

  • According to DeFi Pulse with more than 91 BN USD in total value locked (TVL) in Decentralized Finance (DeFi) applications and the growth of Decentralized Exchanges, we can understand how investors and people in general are moving their capital to Decentralized networks and exchanges instead of being managed by Centralized Crypto Exchanges.

  • While centralized exchanges are simple to use and are frequently the first port of call for new investors and traders, they come with a slew of downsides, which are gradually damaging their desirability among users.

  • Chief among these problems is the fact that they’re centralized. Not only does this pose a security risk, since a large sum of user funds are concentrated in a single place to create a large target for hackers, but it also means these exchanges are subject to the whims and wills of the governments of the jurisdictions in which they operate. 

This problem was most recently seen when Binance — the world’s largest cryptocurrency spot exchange by trading volume — was forced to shutter its regulated activities in the UK by the country’s financial watchdog, the Financial Conduct Authority (FCA). 
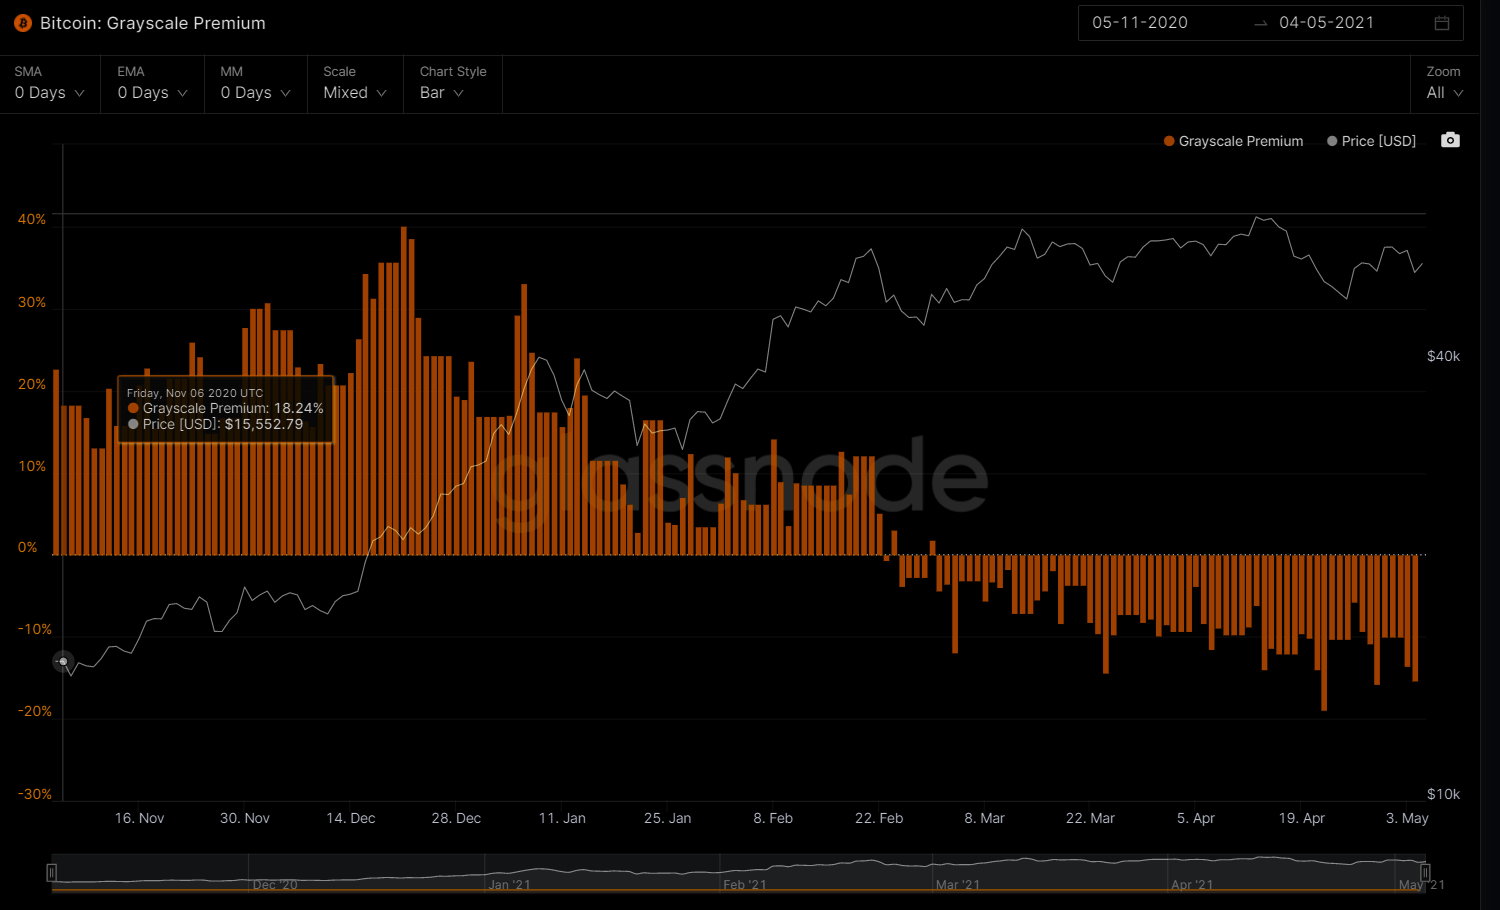
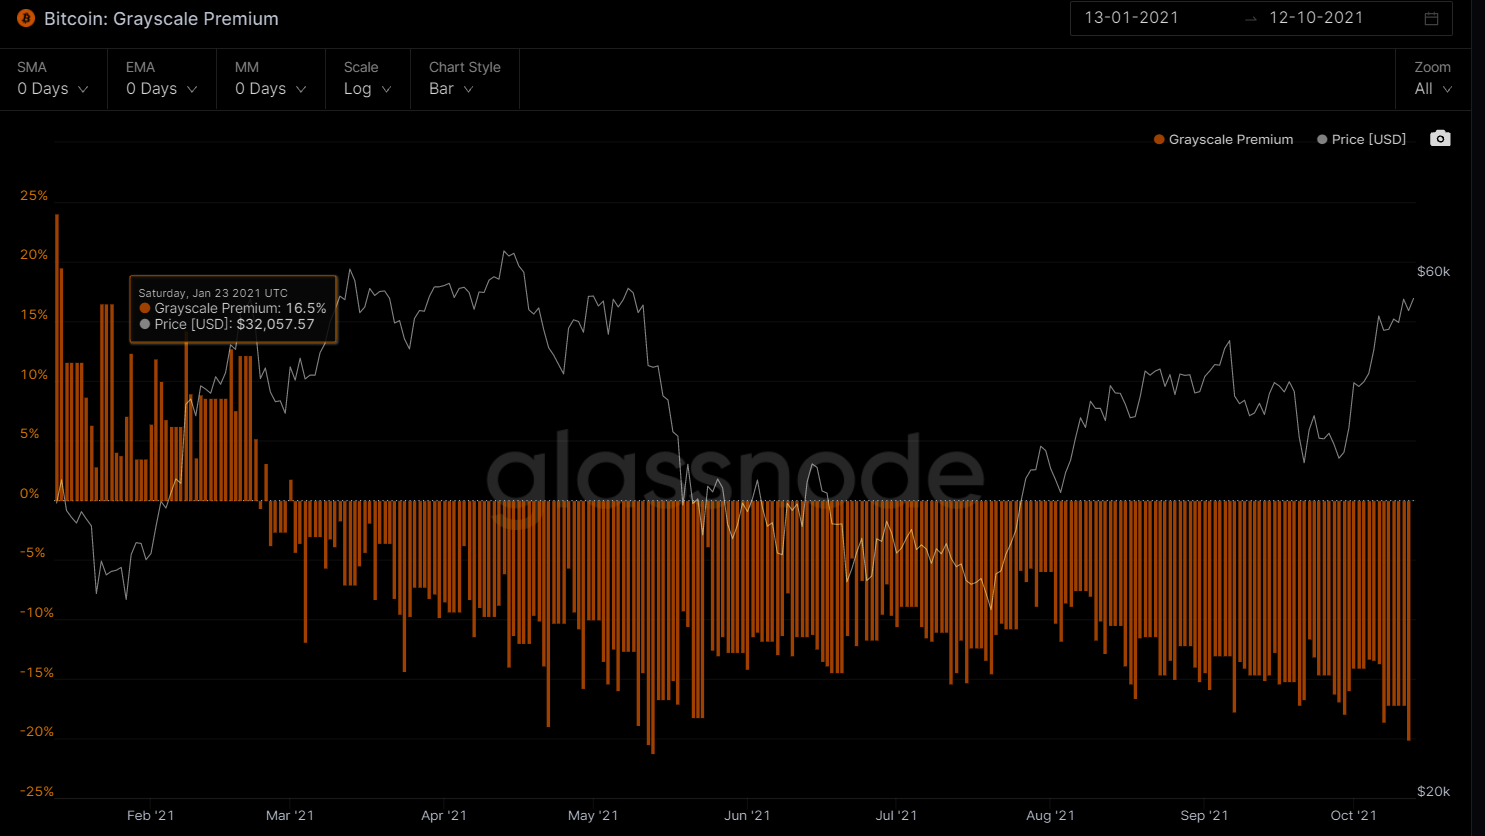
GRASYCALE PREMIUM

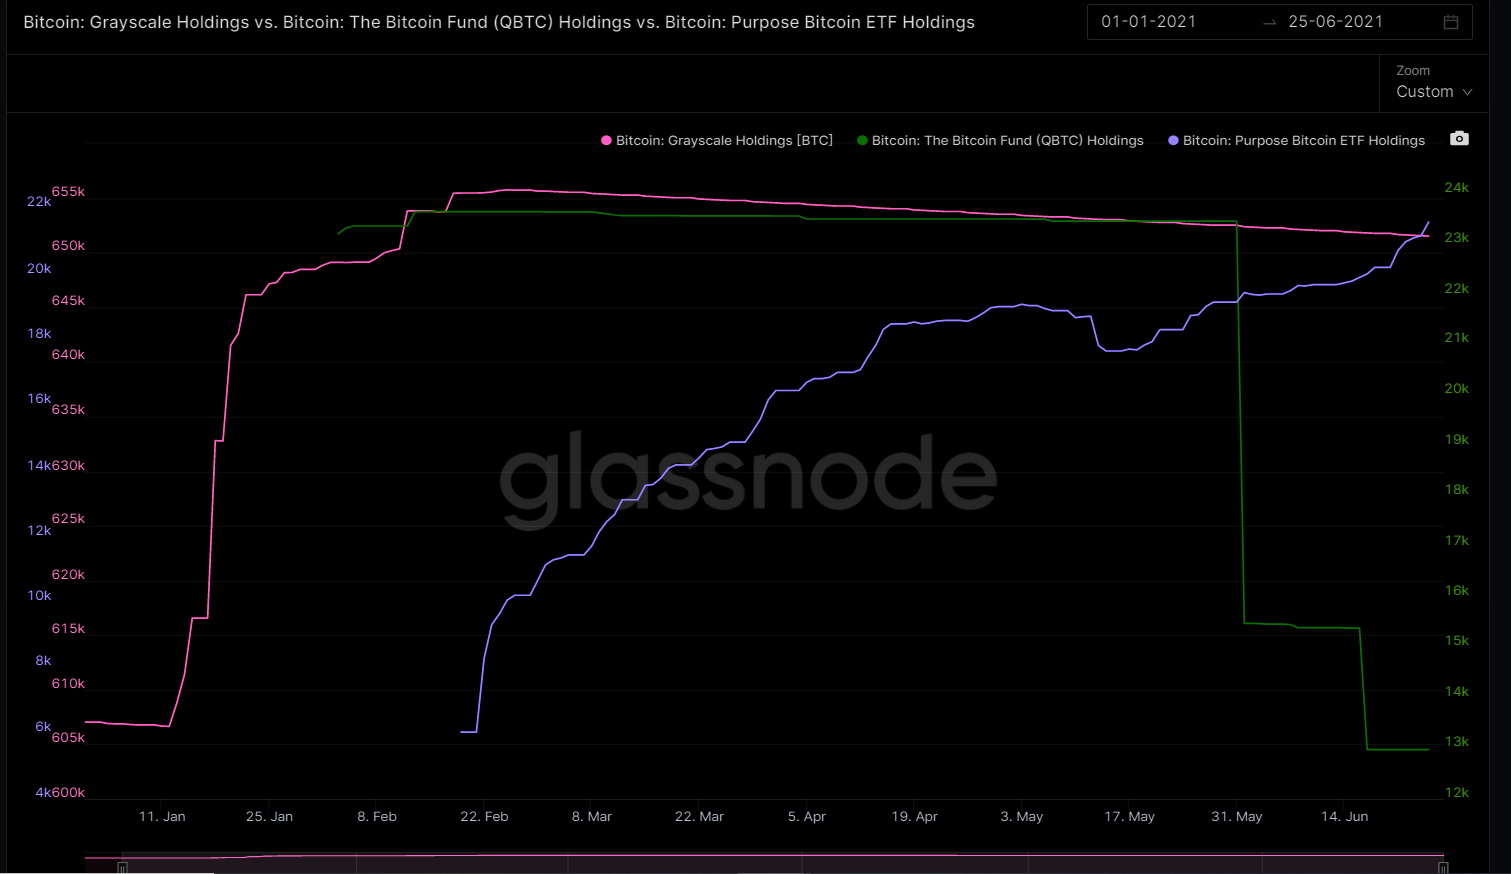
Grasycale Bitcoin Ttust (GBTC) enables accredited investors with a minimum entrance of 50K USD to gain exposure to the price movement of bitcoin through a traditional investment vehicle, without the challenges of buying, storing and safekeeping bitcoins.

Currently with over 36 BN USD of Assets under Management and with a holding of 647,642 bitcoin (BTC) and a share of the price of USD 42.40. The Trust gives the opportunity to investors every six month to secondary market trading and the shares are eligible to become unrestricted. The well known “Grayscale Unlock” moment which always create sentiment in the Bitcoin and Crypto - markets. Because once the unlock of shares happens the investors have the opportunity to buy Bitcoin (BTC) on the spot.

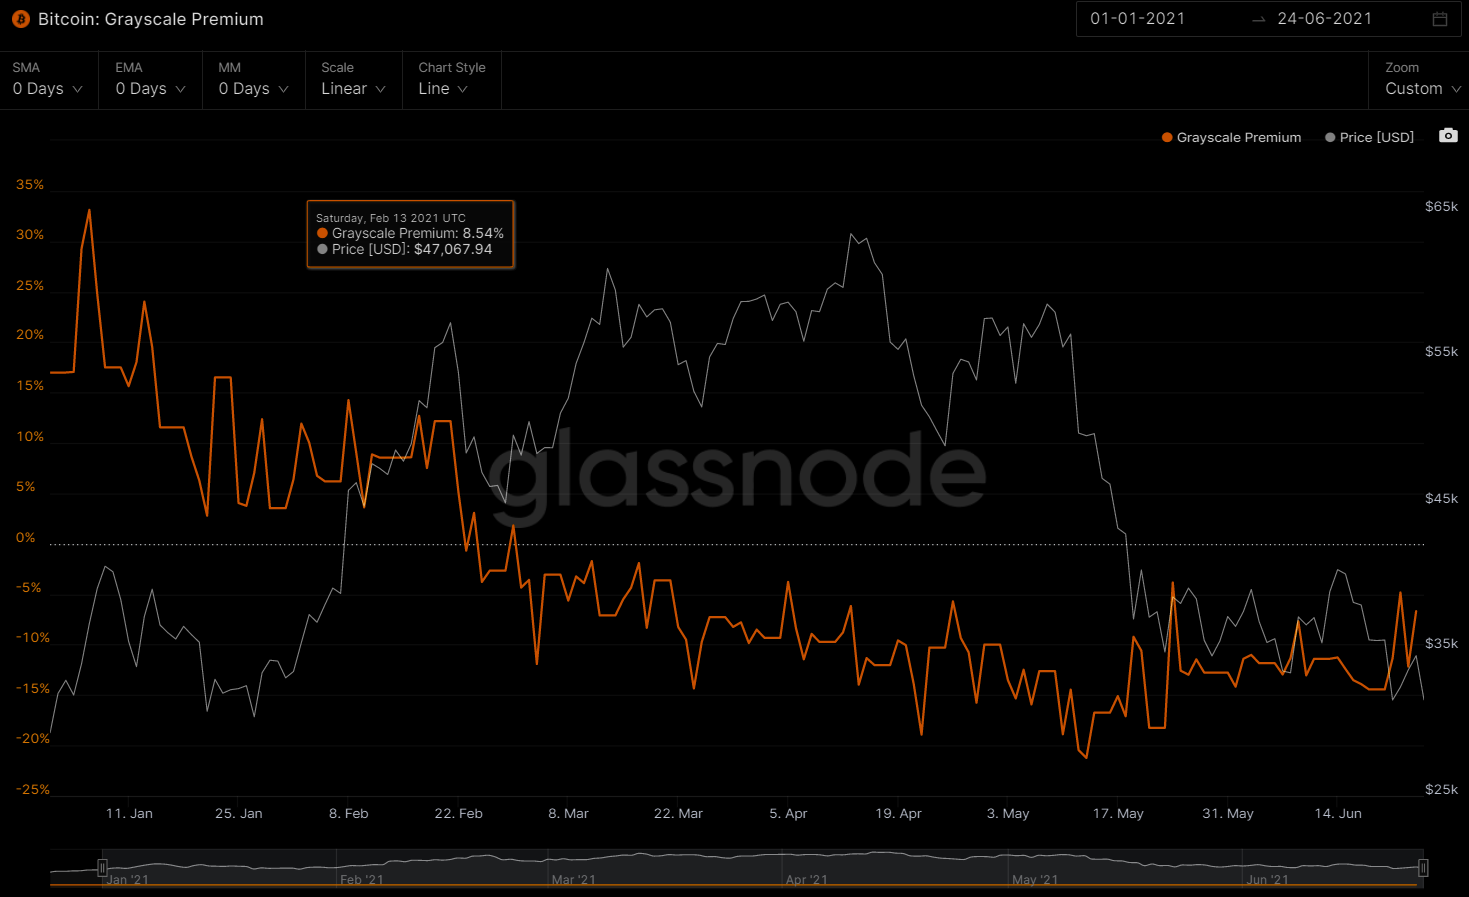
This procedure for investors within GBTC was profitable as long the Grayscale indicator was premium. But Grayscale premium indicator has been negative for the most part of 2021 since February.

During Q3 it started on July with a NAV of -10.52% and continuing the negative trend down to -15.92% on September. On October the first 2 weeks it has reached a new level of -20.06 %.
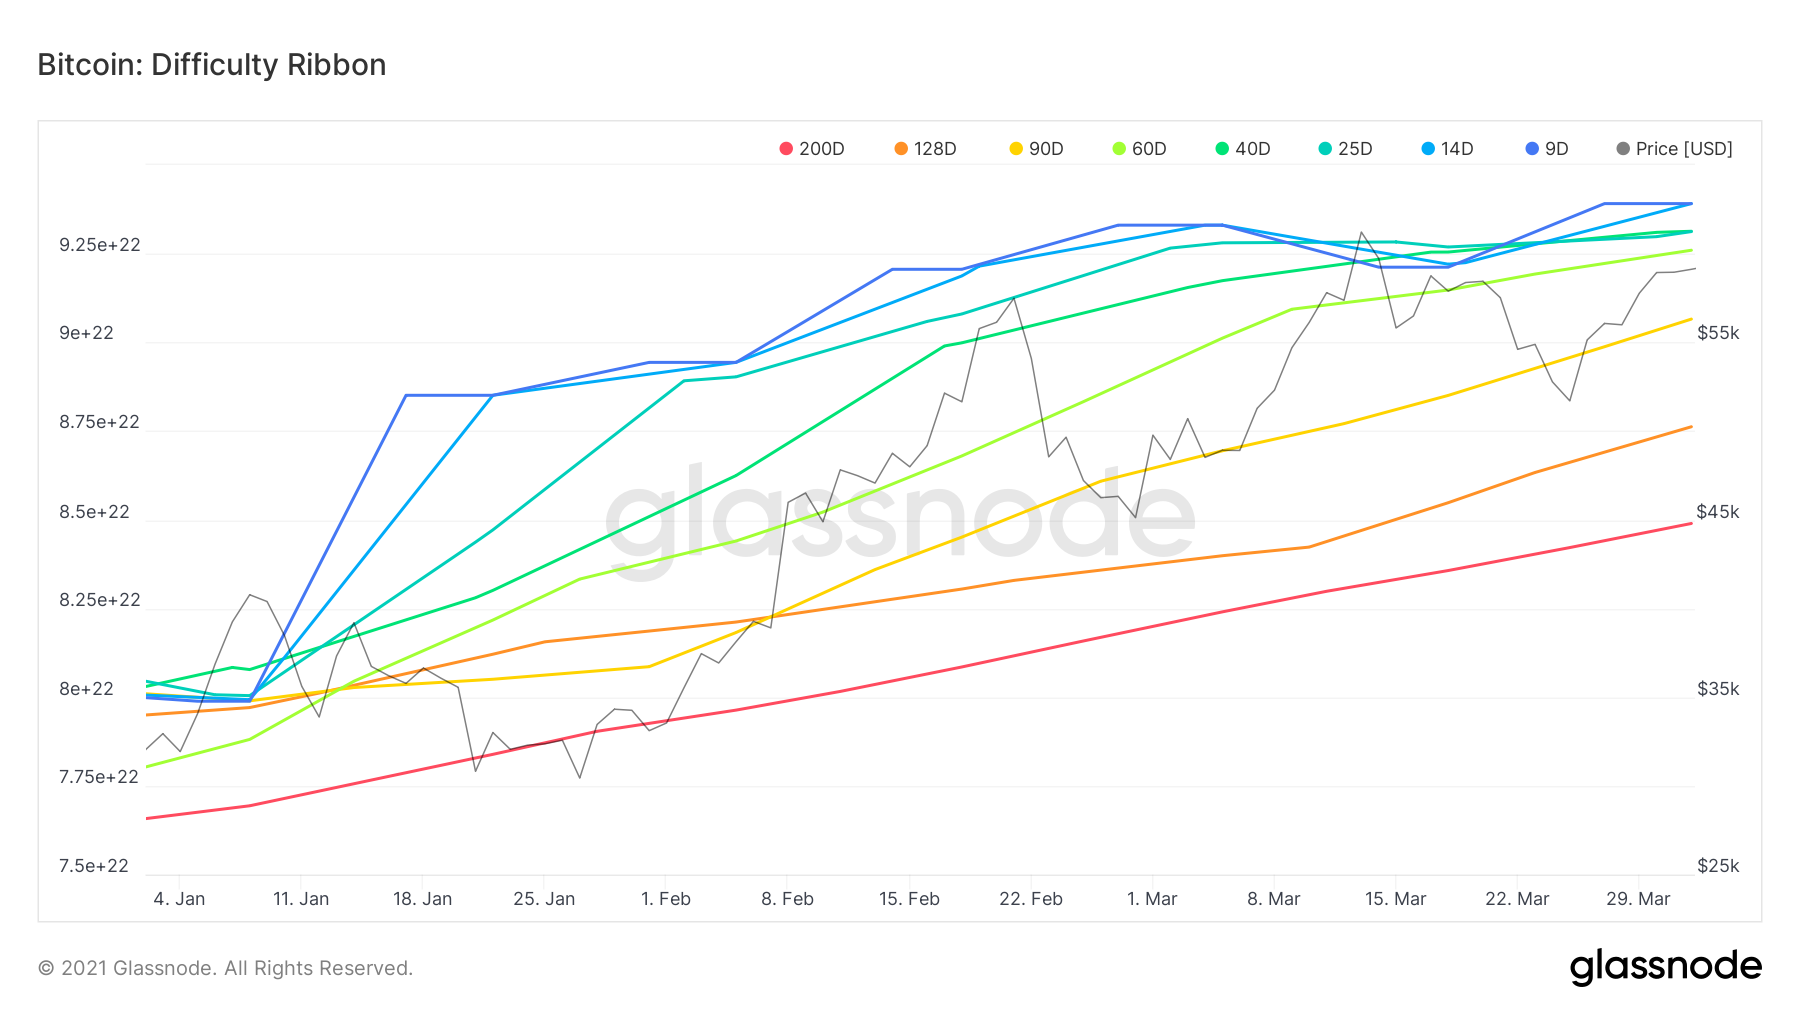
HASH RIBBON

When the ribbon compresses, or flips negative, these are the best times to buy Bitcoin. The ribbon consists of simple moving averages on mining difficulty so we can easily see the rate of change in difficulty.

This visualisation of network mining difficulty speaks to the impact of mining on Bitcoin's price. As new coins are mined into existence, miners sell some of their mined coins to pay for production costs. This produces bearish price pressure.

We can see how at the end of August 2021 were compressed and the moving average of 30days surpassed 60days moving average indicating a good buy signal opportunity.

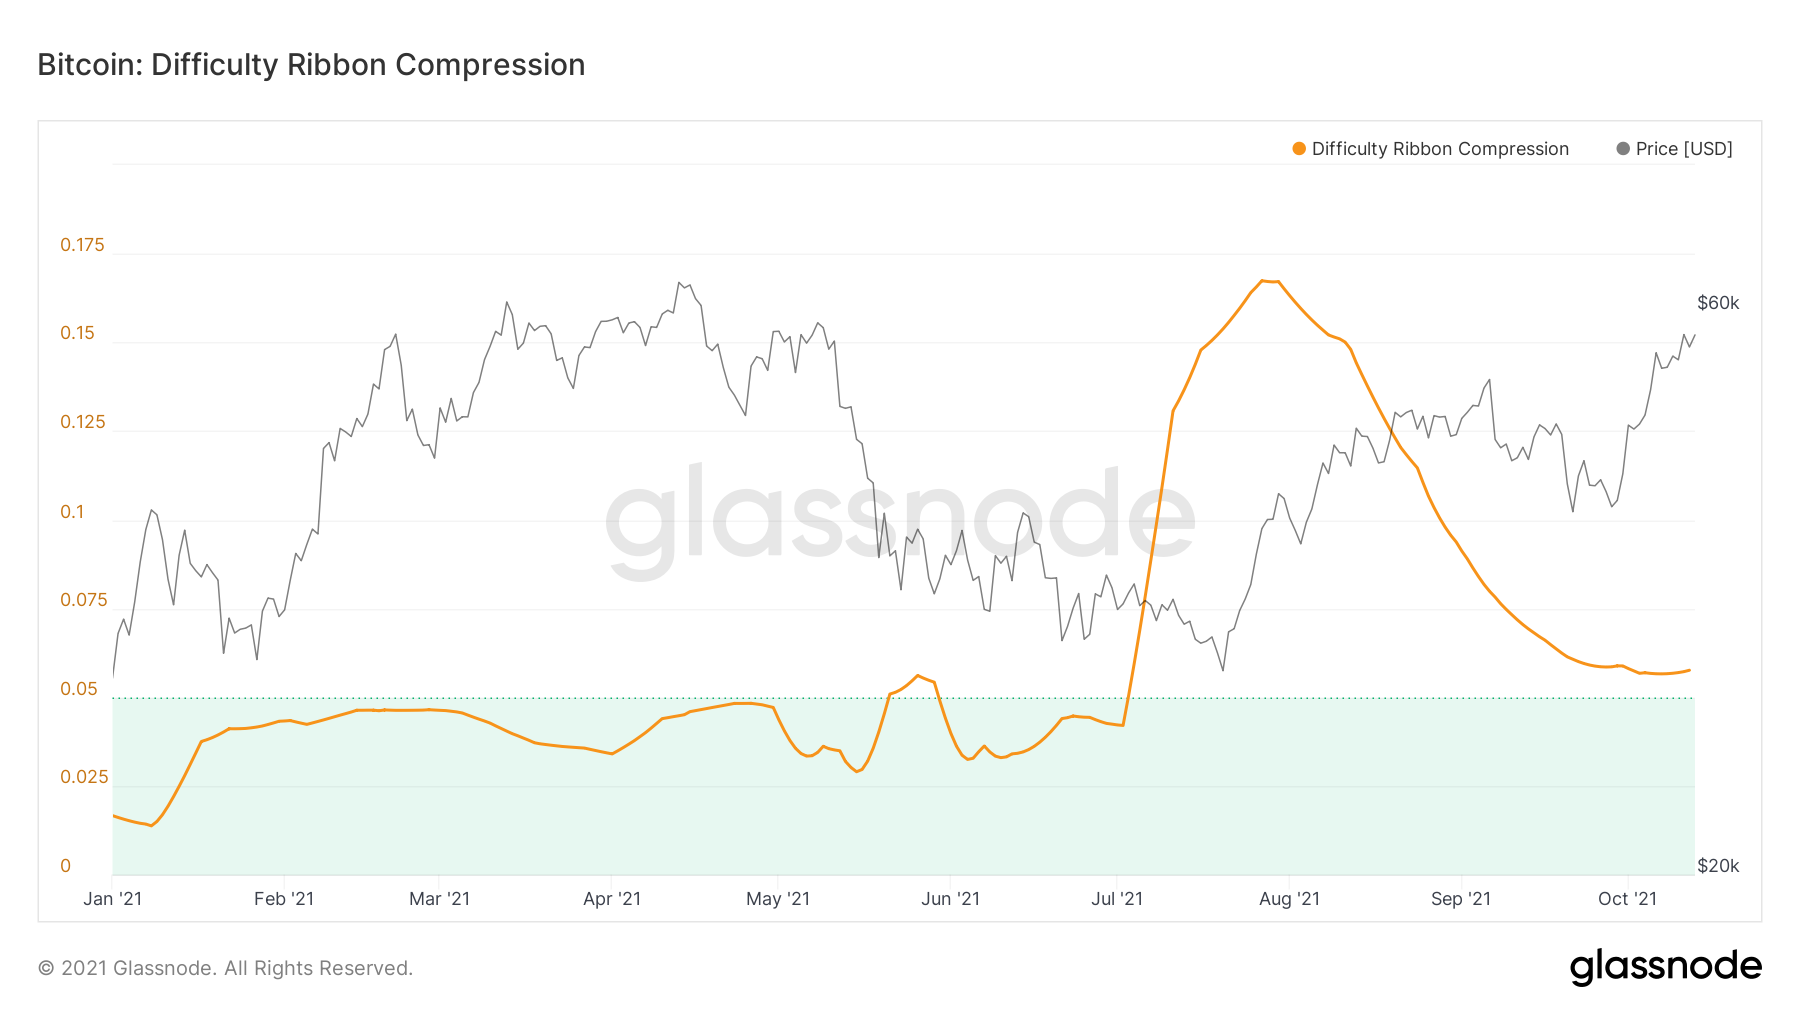
The weakest miners sell more of their coins to remain operational. When it becomes unsustainable, they capitulate, hashing power and network difficulty reduces (ribbon compression), leaving only the strong, who sell less leaving more room for more bullish price action.

Typically we see this at the end of bear cycles, after miners capitulate, the lack of miner selling pressure allows the price to stabilise and then climb; the classic accumulation bottom.

That´s all for today. Remember to subscribe to our newsletter here

DIGITAL ASSET RECAP 06 21

Welcome to our new Bitcoin (BTC) on-chain analysis for June 2021. We go in detail in all metrics and core stats that shaped the Bitcoin Markets during the last few months specially in May and June 2021. Covering from main indicators, Crypto Whale Wallets , Futures volume and much more.

Remember also to subscribe to our Deep Tech newsletter here, which we send to our Investors & Audience, reviewing the trends, technologies and companies within our portfolio in MobileyourLife and Urano Capital .

BITCOIN (BTC)

The last few months for the Bitcoin markets have been the most intense and tough since 2012.

Before reviewing the month of June, let`s take a look at May 2021.

The month of May 2021 will remain in the history of cryptocurrencies as a drastic month, as Bitcoin witnessed its second worst month since 2012, with a 36% loss (only November 2018 was worst with a 37% loss that month)

BTC price graph.PNG

From a price of 58,766 USD on May 8th it went down drastically to USD 31, 676 on June 25th. This has really shocked the markets as Bitcoin (BTC) came from an ATH of USD 63,606 on April 2021 driven mainly by major events we mentioned in our last research here.

With the recent institutional involvement of companies such as Tesla buying 1.5 BN USD worth in Bitcoin announced on a SEC filing last february and Microstrategy with CEO Michael Saylor with a current balance of around 105,085 Bitcoin (BTC) acquired for a total of 2.74 billion USD. (average price per bitcoin (BTC) of 26,080).

It is worth noting that the last purchase of BTC by Microstrategy of $489 million in cash at an average price of roughly $37,617 inclusive of fees and expenses comes after Michael Saylor having raised 500 MM USD from bond sale in order to buy more bitcoin.

Bitcoin: Grayscale Holdings vs. Bitcoin: The Bitcoin Fund (QBTC) Holdings vs. Bitcoin: Purpose Bitcoin ETF Holdings

Bitcoin: Grayscale Holdings vs. Bitcoin: The Bitcoin Fund (QBTC) Holdings vs. Bitcoin: Purpose Bitcoin ETF Holdings

It created the bullish trend we saw reaching as mentioned an all time high of USD 63,600 per Bitcoin on 04/13 and went down dramatically to USD 34,688 on 03/25 and then to USD 31,587 on 06/21.

From the major involvements since February 2021 on the institutions as mentioned before, the bearish movement on Bitcoin was affected by several facts including the tweets from the CEO of Tesla Elon Musk stating the concern of the high consumption of energy on the Bitcoin network coming from fossil fuels.

And that a transition to renewable energy sources for the Bitcoin miners is a must to a sustainable future for the network.

"We are concerned about rapidly increasing use of fossil fuels for Bitcoin mining and transactions, especially coal, which has the worst emissions of any fuel," Mr Musk wrote.

"Cryptocurrency is a good idea... but this cannot come at great cost to the environment."

He also said the electric carmaker would not sell any of its Bitcoin, and intends to use it for transactions as soon as mining shifts to using more sustainable energy.

BITCON MEAN HASH RATE

One of the main Bitcoin indicators as we always cover is the hash rate. Which in essence is the amount of computing and power being contributed to the Bitcoin network. A higher number of hashes per second produced by miners in the network it means in general a more robust and secure network.

We can see how the Bitcoin mean hash rate has been affected heavily the last few months. Falling from 197 eH/S to 106 eH/s on April due to the black out in China which we covered extensively on our past research here. It did recovered fast going back again on 05/09 to 190 EH/S to start decreasing again to 123 EH/S on 05/18 to 110EH/s on 06/11 to currently being at 85 EH/S. The decrease on the hash rate follows directly the fall on Bitcoin price over the last 6 weeks and the situation currently happening in China.

We can also note the fall on the Bitcoin mining difficulty due to the decrease on the hash rate. Falling from 25.046 trillion to 21 trillion at the beggining of June and currently at 19 trillion.

In May, Beijing called for a severe crackdown on bitcoin mining and trading, setting off what’s being dubbed in crypto circles as “the great mining migration.”

  • Texas is an ideal destination for miners, thanks to its abundance of solar and wind power, its unregulated market, and its crypto-friendly political stance.

China has long been home to more than half the world’s bitcoin miners, but now, Beijing wants them out ASAP.

The way this exodus is measured is as explained earlier, by looking at hashrate, measuring the computing power of all miners in the bitcoin network.

“Given the drop in hashrate, it appears likely that installations are being turned off throughout the country,” continued Carter, who also thinks that probably 50% to 60% of bitcoin’s entire hashrate will ultimately leave China

Despite a lack of reserves that caused dayslong blackouts last winter, Texas often has some of the world’s lowest energy prices, and its share of renewables is growing over time, with 20% of its power coming from wind as of 2019.

It has a deregulated power grid that lets customers choose between power providers, and crucially, its political leaders are very pro-crypto – dream conditions for a miner looking for a kind welcome and cheap energy sources.

Bundle of all active supply age bands, aka HODL waves. Each colored band shows the percentage of Bitcoin in existence that was last moved within the time period denoted in the legend.

Bundle of all active supply age bands, aka HODL waves. Each colored band shows the percentage of Bitcoin in existence that was last moved within the time period denoted in the legend.

Bitcoin as Legal Tender in El Salvador

The President of El Salvador, Nayib Bukele, announced (via video) that he will introduce legislation making bitcoin legal tender in the country. The legislation is likely to pass, given Bukele's effective control of the legislature (and public popularity: ~90%), which would make El Salvador the first sovereign nation to consider bitcoin legal tender.

The government will run a $150mm (initially) "trust-fund" to facilitate exchange between BTC and USD if a merchant doesn't want to take any BTC price risk. The state will provide training and (optional) wallet software to the populace. El Salvador will grant immediate residency to anyone who invests 3 BTC (specifically BTC-denominated) into the country.

In the days immediately following Bukele's announcement, politicians from Paraguay, Argentina, and Brazil all expressed support for bitcoin via twitter, by changing their profile pictures to "laser eyes", a meme in the bitcoin community.

Paul Tudor Jones Targets 5% Allocation to BTC

In a CNBC interview this morning, Paul Tudor Jones emphasized that he likes BTC due its certainty, stating:

I like bitcoin as a portfolio diversifier. The only thing that I know for certain is that I want to have 5% in gold, 5% in bitcoin, 5% in cash, 5% in commodities, at this point in time. I don't know what I want to do with the other 80%. I want to wait and see what the Fed's gonna do, because what they do will have a big impact.

GRAYCASLE PREMIUM

Bitcoin is set to undergo a defining moment in the third quarter of 2021, as around 16,000 BTC are set to be unlocked by the Grayscale Bitcoin Trust. The impact of this move from Grayscale will trigger massive spasms of price volatility for the largest cryptocurrency on the market.

Grayscale Bitcoin Trust, the world’s largest digital-assets fund manager, allows institutional investors to gain exposure to bitcoin through shares in the trust at NAV.

After a mandatory 6-month lock up period, shares are "unlocked," giving investors the option to sell their holdings on secondary markets to retail traders. For much of the past year, secondary shares have traded at a steep premium to NAV, which created a popular carry trade in which investors would purchase shares and profit off of the premium 6 months later. This type of trade helped fuel Grayscale's growth into the single largest holder of Bitcoin, which currently holds 654,600 BTC.

That’s more than 3% of the cryptocurrency’s supply. Grayscale is a unit of Digital Currency Group, which also owns CoinDesk.

Currently the incentive to reinvest is relatively low. The so-called Grayscale carry trade has lost its shine ever since GBTC began trading at a discount in February 2021

Currently the premium in the total value of Bitcoin Trust shares (GBTC) to the Net Asset Value (NAV) of the Trust holdings of Bitcoin is at discount of -11.73%.

Grayscale Premium.PNG

BTC FUTURES

Future Open Interest BTC.PNG

The arbitrage trade has become less attractive as the bitcoin futures curve flattened over the past few months.

Contango, a term used to describe the bullish arbitrage, occurs when the bitcoin futures price is higher than the spot price. Since April, bitcoin’s contango has narrowed as bullish sentiment waned. The one-month bitcoin futures contract has already moved into backwardation, which means the futures price is lower than the spot price. That’s another bearish signal.

Arcane Research also pointed to the negative funding rate on bitcoin perpetual swaps as a sign that short traders are in control.

glassnode-studio_bitcoin-futures-perpetual-funding-rate.png

Perpetual swaps are a type of derivative in cryptocurrency markets used to bet on future prices, similar to futures contracts in traditional commodities markets. A negative funding rate means traders who are short – betting on further price declines – are paying traders who are long, or positioned bullish, for leverage.

All exchanges have had negative perpetual funding rate during June. From 0.01% to 0.13% being the highest from Bitfinex with 0.131 % on June 25.

BITCOIN DELTA CAP

Delta Cap is the difference between Realized Cap and Average Cap, where Average Cap is assumed to be the life-to-date moving average of Market Cap.

It attempts to detect major market bottoms in Bitcoin cycles. We wanted to cover this metric as we can observe from the graph how it reflects both the bottom Bitcoin (BTC) had on March 2020 and more recently now in April 2021 reaching a bottom of USD 50,020 per Bitcoin to continue decreasing to USD 34,613 per Bitcoin by the end of May 2021 to a current price of around USD 35,900 per bitcoin at the time of press release.

BTC DELTA CAP.PNG

Delta Capitalization

Delta cap is, as seen next, a hybrid of sorts — half “fundamental,” half “technical.” It is calculated through the following formula, measuring the difference between two long-term Bitcoin moving averages:

Delta Cap = RealizedCap - AverageCap

Realized Cap

Invented by the team of Coinmetrics, instead of counting all of the mined coins at current price, the coins are counted at the price when they last moved through the blockchain. This approximates the USD value paid for all the bitcoins in circulation

Average capitalization

Instead of setting a fixed period for calculating a moving average (e.g., a 200-day MA), this is a life-to-date, cumulative simple moving average that serves as the true mean of the whole history of market cap.

As seen at first glance, delta cap provides an excellent framework for catching global bottoms — or at the very least bottoms near the floor of the bear cycle.

BITCOIN : MVRV Z-Score

The MVRV Z-Score is used to assess when Bitcoin is over/undervalued relative to its "fair value". When market value is significantly higher than realized value, it has historically indicated a market top (red zone), while the opposite has indicated market bottoms (green zone).

Technically, MVRV Z-Score is defined as the ratio between the difference of market cap and realized cap, and the standard deviation of market cap, i.e. (market cap – realized cap) / std(market cap).

We can observe how it got to the red zone on February 21 when the indicator was at 7.63. Currently with the price of Bitcoin at 35,900 USD indicator went down significantly to 1.76. If continue the bearish trend could replicate last March 2020 when MVRV Z - Score decreased down to -0,17.

glassnode-studio_bitcoin-mvrv-z-score.png

That`s all for today folks.

Thank you for reading our Bitcoin weekly recap. Stay tuned as we will be publishing more newsletters on the following markets from Bitcoin, Ethereum - DeFi and Stablecoins.

MOBILEYOURLIFE TEAM

DECENTRALIZED LANDSCAPE

Welcome to a new edition. This time we take on part II on what`s been happening in the Bitcoin space the last 2 weeks.

Remember to subscribe to our Deep Tech newsletter here (https://www.mobileyourlife.com/) which we send on a weekly basis to our Investors & Audience, reviewing the trends and technologies we are working on our portfolio.

Here we go.

Last recap we published on Bitcoin markets and on-chain anaylisis, which you can check here. We covered not only the swings and movements on the price but also the correlation of Bitcoin and the Metcalfe Law, movement on the Crypto whales wallets , the bitcoin mean hash rate, Grayscale Premium and its recent rise of competitors such as the Bitcoin Fund (QBTC premium) and Purpose Bitcoin ETF.

We wanted to continue our report this time with the recent drop Bitcoin had on the last few days and the impact on the institutional updates specially with Elon Musk and his recent statements.

From reaching an ATH on May 10 of 59,325 USD per Bitcoin to falling to a price of 48,011 USD on May 13th. Currently trading at 50,820 USD per Bitcoin at the moment of this press release. The decrease on Bitcoin comes after the recent comments from Elon Musk when suspending any purchase of vehicles using the digital asset.

BITCOIN PRICE UPDATED.PNG

Elon Musk CEO, early stage investor and product architect of Tesla Inc. Announced on May 12th that Tesla suspended vehicle purchases using Bitcoin. The updates comes as the concern from Elon Musk on the use of fossil fuels for Bitcoin mining and transactions.

BTC TWITTEr.PNG

He clarified on his twitter account that believes in Cryptocurrencies and that are good idea in many levels but that it can not come at great cost to the environment. It is good to note that Tesla has not sold any Bitcoin(BTC) they have in their balance sheet and will intend to use it for transactions as soon as mining transitions to more sustainable energy.

It is worth noting a few metrics on the Bitcoin Network we always touch base. Such as the Bitcoin hash rate, the net inflow of Exchanges and SOPR metric. The Bitcoin mean hash rate has been recovering since the blackout in china and the collapse on the network. It went from a low point of 106 EH/s to recovering to a level of 185 EH/s per second. On the other hand we notice an inverse trend on the net inflow volume from /to exchanges and the Bitcoin Price.

Comparison (BTC price vs Net Inflow from/to Exchanges vs Hash Rate vs SOPR).

BTC comparison.PNG

You can see in the first two weeks of May, when BTC price was around 56K USD it was a negative inflow on exchanges of -6,094 BTC following up in one day to a positive net inflow volume from/to exchanges of 27,000 BTC which was completely inversed as while the inflows to exchanges were increasing, the Bitcoin price went down from 56,714 USD to 49,729 USD per Bitcoin.

With the recent decrease on the Bitcoin price we can notice as well that the spent Output Ratio is also below 1 since may 13th. Meaning that the owners of the spent outputs are in loss at the time of the transaction. Remember that Bitcoin: Spent Output Profit Ratio (SOPR) It’s calculated from spent outputs. It’s the realized value (USD) divided by the value at creation (USD) of the output. Or simply: price sold / price paid.

glassnode-studio_bitcoin-spent-output-profit-ratio-sopr-24-h-moving-median.png

Decrease of Bitcoin Balance on the Exchanges

Despite the ATH of Bitcoin the last year. We have seen a decrease of Bitcoin on the Crypto-Exchanges from 2020. The dynamic of decreasing BTC exchange balances gives credence to the notion that investors are less interested in actively trading BTC but would rather custody the asset themselves for extended durations.

Bitcoin Balance on Exchanges.PNG

The dynamic, however, is also likely supported by the proliferation of self-managed wallet solutions, such as Ledger’s hardware wallets, that have made custodying BTC more accessible to a wider range of investors. With almost every BTC investor up, holders are, nonetheless, continuing to defer profit-taking. We would argue that the dynamic underscores the buy-and-hold nature of the current rally.

During 2021 we can see the balance decreasing from 2, 554, 045 millions of BTC held in Crypto-Exchanges to a low of 2,427,541 millions of BTC on April 25th. Having a short increase to up to 2,454,000 mm BTC.

glassnode-studio_bitcoin-balance-on-exchanges-all-exchanges-24-d-moving-median.png

Bitcoin Futures.

Exchange operator CME Group Inc said on Tuesday more than 100,000 micro bitcoin futures were traded in the first six days after the contract's launch.

Micro Bitcoin futures will be one-tenth the size of one bitcoin. The smaller-sized contract will provide market participants – from institutions to sophisticated, active, individual traders – with one more tool to hedge their spot bitcoin price risk or execute bitcoin trading strategies in an efficient, cost-effective way, all while retaining the features and benefits of CME Group's standard Bitcoin futures. In 2021-to-date, 13,800 CME Bitcoin futures contracts (equivalent to about 69,000 bitcoin) have traded on average each day.

glassnode-studio_bitcoin-futures-open-interest-current (2).png

Currently on Binance there is almost 4BN USD of open interest or net value of all open positions.

Druckenmiller Sees End to USD Reserve Status, 'Crypto' as Solution

Legendary macro investor, Stanley Druckenmiller, followed up a WSJ opinion piece titled "The Fed is Playing with Fire" with a CNBC interview in which he lays out the ramifications for the dollar given the Fed's QE persistence. He said that the dollar is "more likely than not" to lose its reserve currency status in the next 15 years, and calls out "crypto" as the replacement (note that Druckenmiller holds bitcoin)

Regarding crypto, he said:

5 or 6 years ago, I said that crypto was a solution in search of a problem. And that's why I didn't play crypto the first wave. We already had the dollar, what did we need crypto for? Well the problem has been clearly identified. It's Jerome Powell and the rest of the world's central bankers. There's a lack of trust. So sort of groping for an answer, for a central case, a best guess; and it's hard to make a forecast 3 months from now, much less 15 years from now, I think the most likely replacement would be some kind of ledger system invented by some kids from MIT or Stanford or some other engineering school, that hasn't even happened yet, that can replace the dollar world wide. I don't know what that will be. I just know that if the Fed is forced to monetize the debt.

Bitcoin Puell Multiple

This metric looks at the supply side of Bitcoin’s economy – bitcoin miners and their revenue

It explores market cycles from a mining revenue perspective. Bitcoin miners are sometimes referred to as compulsory sellers due to their need to cover fixed costs of mining hardware in a market where price is extremely volatile. The revenue they generate can therefore influence price over time.

The Puell Multiple is calculated by dividing the daily issuance value of bitcoins (in USD) by the 365-day moving average of daily issuance value.

There are periods of time where the value of bitcoins being mined and entering the ecosystem is too great or too little relative to historical norms.

Understanding these periods of time can be beneficial to the strategic Bitcoin investor.

The chart below highlights periods where the value of Bitcoin's issued on a daily basis has historically been extremely low (Puell Multiple entering green box), which produced outsized returns for Bitcoin investors who bought Bitcoin here. It also shows periods where the daily issuance value was extremely high (Puell Multiple entering red box), providing advantageous profit-taking for Bitcoin investors who sold here.

glassnode-studio_bitcoin-puell-multiple (1).png

We can notice that December 2017-January 2018 were periods that Bitcoin investors that sold were in the red box making huge profits as so the same Bitcoin Investors (buyers) who bouth during Crypto-Winter in January 2019 or during pandemic in 2020 were acquiring Bitcoin on an extremely low daily issuance. (green box). The indicator (Puell Multiple) currently on May 2021 is at 2.10.

That`s all for today folks.

Thank you for reading our Bitcoin weekly recap. Stay tuned as we will be publishing more newsletters on the following markets from Bitcoin, Ethereum - DeFi and Stablecoins.

MOBILEYOURLIFE TEAM

Bitcoin (BTC) Weekly Recap.

Welcome to a new edition of the Bitcoin recap. Where we analyze the core stats and metrics on the Bitcoin Markets.

Remember to subscribe to our Deep Tech newsletter here (https://www.mobileyourlife.com/) which we send on a weekly basis to our Investors & Audience, reviewing the trends and technologies we are working on our portfolio.

BITCOIN (BTC)

From our last report we covered how the Bitcoin network due to the blackout in China primarily got affected in its network and the hash rate dropped significantly following it with the price as well. If you want to read our previous post where we go in detail on the event happened with the Bitcoin Network and the technical on-chain analysis please read it here.

What we can notice is that after the collapse on the network in mid April, the Bitcoin network started recovering coming from a low of 114 EH/s hashes per second to 153 EH/S hashes per second by April 30th and currently this first week of May reached an ATH of 210 EH/s hashes per second.

During the second half of the month, although the Bitcoin network has been recovering quite fast from its attack. Bitcoin prices went down as low as 47,296 USD on April 23rd and 47,579 USD on April 25th. From that point Bitcoin started a bull run to recover, reaching highs of 55,508 USD on April 28 and 57,122 USD on April 30th.

BTC PRICE.PNG

CRYPTO WHALES

It is worth noting that Crypto whales and major investors, with Bitcoin balance higher of 1K BTC and of 10K BTC respectively; have been declining since February 2021. From 2,488 wallets 1K coins at the beggining of February down to almost 2,228 number of addresses on the 30th of April.

glassnode-studio_bitcoin-number-of-addresses-with-balance-≥-1-k.png

The same pattern is happening with addresses higher or equal to 10K Bitcoin, which dropped in mid February. From a total of 98 addresses 10K coins with a price of 56,134.54 USD by February 20th to 86 addresses on April 30th. Currently trading at a price of 54,843 USD per coin at the time of press release. The reason we mentioned this is that the movement on whales have been decreasing dramatically despite the bullish market we have had the last year.

glassnode-studio_bitcoin-number-of-addresses-with-balance-≥-10-k.png

From the last halving event in 2020, to the entrance of institutional investors and companies such as Microstrategy and Tesla buying billions of USD in Bitcoin, we have seen in the last few months corrections in the market starting from February 2021, since the decrease on the number of wallets with amounts higher of 1K and 10K coins.

According to crypto capital advisor Timothy Peterson, there has been the largest reduction in BTC wallets of that size or greater in history. He claimed back in March that the reduction is the largest historically across a 40-day period, beating even the 2014 and 2018 bear markets in “both absolute and percentage terms.”

Metcalfe Law in Bitcoin.

The movement on Crypto whales (users with the highest amount of Bitcoin currently) will take us to Metcalfe Law.

According to the research of Timothy Peterson on Metcalfe Law and using Bitcoin as an example. It provides convincing empirical evidence that bitcoin’s price formation is not a noisy result of emotional investing but instead is founded on economic principles of value that have only recently begun to be recognized: network economics.

There is compelling evidence that suggests that the growth and price of bitcoin and other cryptocurrencies are likely to proceed according to a relatively straightforward mathematical model similar to the growth curves of Facebook and other networks. So the long-term growth rate in users has considerable effect on the long-term price of bitcoin.

Metcalfe Law.PNG

The internet is an ideal tutorial for network economics instruction. It is apt for comparison to Bitcoin because Bitcoin relies on internet connectivity to function. Both have had varying degrees of acceptance by among various countries, yet both grew in acceptance over time (Exhibit 1).

To date, the typical approach to cryptocurrency valuation has been via Metcalfe’s law. Commonly expressed in shorthand as n2 , it is the approximate value of P when n is large. We show that price is a function of n users, as Metcalfe’s law states.

BTC FUTURES

glassnode-studio_bitcoin-futures-open-interest-current (2).png

Current future open interest on Bitcoin is above 3.50 BN USD on Binance followed by exchanges such as Okex, Huobi, FTX and CME with open interest ranging from 2.00 to 2.50 BN USD.

As bitcoin gradually matures and the ecosystem surrounding it expands further, the original cryptocurrency is increasingly behaving like a commodity.

Thanks to a robust futures market that continues to grow, derivatives contracts on bitcoin also gain popularity and meaningfully impact its pricing structure. This has resulted in a unique development that has unfolded over the last several months.

Bitcoin Futures Volume.PNG

Future volumes reached an ATH on April 18th with an amount surpassing the 151 BN USD to then decrease by the end of the month to an amount close to 56 BN USD

Known as “contango,” bitcoin futures contracts to be settled months down the road are trading at a significant premium to spot prices. This delivers a serious arbitrage opportunity that could temporarily result in relatively high returns with minimal risk.

Contango has already defined bitcoin pricing for a considerable period and could continue, but how long remains the chief question on traders’ minds. The reasons attributed to this pricing differential are numerous, but it’s hard to pin down one exact catalyst given the decentralized nature of cryptocurrency and lack of data.

BTC OPTIONS

Bitcoin options contracts—which give traders a chance (but not the obligation) to buy BTC at a set price, can typically be traded up until the last Friday of each month. They offer different price levels at which traders can pull the trigger and buy the asset.

In February, when $3.3 billion in options contracts were due to expire, Bequant head of research Denis Vinokourov told Decrypt, “Options flows are not yet at the size where they can move the market.” In Vinokourov’s estimation, there was more BTC HODLing than buying and selling at that point, meaning the trading would have a neutral effect on prices. 

Lunde says that trend is continuing, especially after the mid-April crash, when the price of Bitcoin fell from a high above $63,000 down to $49,000 in 10 days. “In general, there seems to be more holding right now, than earlier in April,” he said. 

Some market participants and analysts have pointed to the recent accumulation by corporations, including Tesla, Microstrategy, and Grayscale Bitcoin Trust demand as one factor behind a shortage that has helped push prices higher. If accompanied by miners “hodling” bitcoin in the hopes of further price increases due to the lower mining rewards precipitated by the halving, it could also result in a significant supply shortage.

Grayscale Premium & Institutional Investors

GRAYSCALE PREMIUM UPDATED.PNG

Grasycale Bitcoin Trust (GBTC) which is trading at a negative premium the last 2 months, hits a record low of -18.92%.

That means the market price of GBTC shares is about 19% lower than its net asset value or NAV. A negative premium means the investor expects nothing in return for investing in that product.

Arcane Research pointed the emergence of alternative instruments like launch of Bitcoin ETF’s, and the purchase of the BTC directly by individual companies as reasons for the discount.

Recently, the Canadian regulator approved a exchange-traded fund (ETF) based on the BTC available to investors in US dollars. A similar instrument was also listed in Brazil.

In the spring of 2021, the U.S. Securities and Exchange Commission (SEC) began reviewing two applications to launch ETFs from WisdomTree and VanEck.

Grayscale plans to convert GBTC into an exchange-traded fund (ETF). Which could potentially be according to market experts the best alternative for Grayscale.

QBTC - The Bitcoin Fund

glassnode-studio_bitcoin-the-bitcoin-fund-qbtc-premium.png

The Bitcoin Fund is a closed-end fund incorporated in Canada. The fund seeks exposure to digital currency bitcoin and the opportunity for long-term capital appreciation.

The Fund will invest in long-term holdings of bitcoin to provide investors with a convenient alternative to a direct investment in bitcoin. The Fund will not speculate with regard to short-term changes in bitcoin prices.

Within the month of April had a low of -4% in its premium.

That`s all for today folks.

Thank you for reading our Bitcoin weekly recap. Stay tuned as we will be publishing more newsletters on the following markets from Bitcoin, Ethereum - DeFi and Stablecoins.

MOBILEYOURLIFE TEAM


Bitcoin (BTC) & Blockchain Weekly recap (Week 14-15 & 16)

Welcome to a new edition of the Bitcoin recap. Where we analyze the core stats and metrics on the Bitcoin Markets. We also touch base and cover the Institutional news.

Remember to subscribe to our Deep Tech newsletter here (https://www.mobileyourlife.com/) which we send on a weekly basis to our Investors & Audience, reviewing the trends and technologies we are working on our portfolio.

BITCOIN (BTC)

Bitcoin price during April has been quite intense and active in its trading. On April 2th closed on a price of USD 60,220 and then decreased down to USD 57,235. During that short period BTC closed on April 5th on USD 59,710 per coin.

The following 2 days, Bitcoin experienced a sell-off. Decreasing the price down to USD 55,982 per coin. From April 7th to April 14th, BTC price reached an all time high (ATH) of USD 64,666 USD.

BTC PRICE .png

Bitcoin (BTC) plunged to $50,528 on April 18, once again demonstrating the manner correlation between price action and hash rate. After losing psychological support of $60,000 earlier this week, BTC/USD tried to consolidate once again, but the selling pressure was too high that $10 billion worth long positions were diluted in a matter of few minutes. The clear demonstration of well-known phrase “price follows hash rate,”the Bitcoin-US dollar pair lost valuation. According to Willy Woo, “Price and hash rate has always been correlated.”

HASH RATE PRICE.PNG

Data shared by Wu Blockchain has shown a Bitcoin mining pool hashrate plummet in Chinese based operations this week. According to reports, this comes as China initiate a government-instituted blackout in the North-West part of the country for safety inspections. On the 16th a chart shows that Antpools fell by 24.5%, BTC.com by just under 19%, Poolin by 33% and Binance by 20%. In the last two days, the hashrate has made a recovery and is almost back to typical levels.

Additional to that, 9000 BTC was deposited into Binance, provided enough selling pressure to drop the Bitcoin price below $59k support, forcing the $4.9b of liquidations.

Captura.PNG

STOCHASTIC OSCILLATOR.

To understand it better, a stochastic oscillator is based on the idea that in an upward trending market prices will close near their high and in a bear market prices will close near their low. A stochastic oscillator will show oversold when it is below 20 and overbought when it is above 80.

STOCHASTIC.png

We can note from the graph that when the price of Bitcoin was around 55-56K USD, the stochastic was showing a metric below 20.00. (As you ca note in the graph on April 4th went down the metric to -0.10.

Same case happened when Bitcoin was above 64K USD, the indicator (stochastic) was above 80.00. (to be more precise around the levels of 99.78).

COINBASE IPO

The New IPO Coinbase (COIN) was a total success. Closing at $328.28 per share after direct-listing on the Nasdaq Wednesday -and the stock's run may not yet be done. BTIG analyst Mark Palmer made the case for Coinbase stock reaching $500 a share within a year (nearly 50% upside) and for several specific reasons.

Few facts on Coinbase

  • $223 billion in crypto assets stored on its platform through the end of Q1 2021. That's 11.3% of all cryptocurrencies in existence currently, and triple the cryptocurrency market share that Coinbase possessed three years ago

  • The company had 56 million "verified users" at the end of Q1 2021 notes Palmer, up 30% from the end of Q4 2020.

  • In a Q1 2021 estimated earnings report released April 6, Coinbase revealed that its revenues were $1.8 billion for the quarter, which was more than the company's revenue for all of fiscal 2020

  • Trading volume also appears to be accelerating, up nearly four-fold sequentially to $335 billion in just the three months from Q4 2020 to Q1 2021

  • And Coinbase is already a profitable operation.

glassnode-studio_bitcoin-balance-on-exchanges.png

When observing the SOPR metric we can review is at full reset. The profit from long-term holders are completing, very little sell power unless investors dare to sell at loss. It’s calculated from spent outputs. It’s the realized value (USD) divided by the value at creation (USD) of the output. Or simply: price sold / price paid.

When SOPR > 1, it means that the owners of the spent outputs are in profit at the time of the transaction; otherwise, they are at a loss. Currently at the time of press release is down to 1.00.

glassnode-studio_bitcoin-spent-output-profit-ratio-sopr-24-h-moving-average.png

Former CIA Director Finds Bitcoin's Use in Illicit Finance to be Minimal

Former CIA Acting Director, Michael Morell, authored a report recently that looked into Bitcoin's use in illicit finance. In short, he found that illicit use of Bitcoin is far less than many people assume, and probably even a significantly smaller share of the bitcoin-economy than illicit use of dollars are vs global GDP.

The blockchain ledger on which Bitcoin transactions are recorded is an underutilized forensic tool that can be used more widely by law enforcement and the intelligence community to identify and disrupt illicit activities. Put simply, blockchain analysis is a highly effective crime fighting and intelligence gathering tool.

According to a recent study by blockchain analytics firm Chainalysis, illicit activity among all cryptocurrencies as a percent of total cryptocurrency activity from 2017 to 2020 was less than 1 percent. For Bitcoin specifically, blockchain analytics firm CipherTrace estimates that illicit activity makes up less than 0.5 percent of total transaction volume.

All of this together suggests a broader point—that the illicit use of cryptocurrencies in general and Bitcoin in particular, as a share of total market activity, is certainly not higher than it is in the traditional banking system and is most likely less.

Bitcoin Futures

glassnode-studio_bitcoin-futures-open-interest-current (2).png

Bitcoin futures open interest reachs new highs ahead of Coinbase’s direct listing on the Nasdaq on April 14. More than 27 BN USD when BTC reaching new ATH.

Crypto market data aggregator Glassnode states that Bitcoin open interest has exceeded $27 billion for the first time as Bitcoin (BTC) pushed into new record highs above $63,000. The milestone suggests traders may be speculating on higher prices, although some may also be hedging against incoming volatility.

Main trading activity is on Binance, where the $5.2 billion in positions accounts for almost 20% of all outstanding positions being held on the exchange. It’s followed by Bybit with $4.66 billion, OKEx with $3.75 billion, and then Huobi, FTX and CME with roughly $3 billion each.

glassnode-studio_bitcoin-futures-open-interest.png

GRASYCALE PREMIUM

The downtrend in Grayscale Bitcoin Trust premium has extended. At the time of publication, the premium stands at -12.02%.

Marlton’s data indicates that GBTC’s premium discount represents an estimated $3.1 billion in losses to stockholders. The firm has called for a modification to the stock trading mechanism that would allow them to sell or buy shares at specific prices and at a specific time.

glassnode-studio_bitcoin-grayscale-premium (1).png

As Ben Lilly points out, the advent of new options to gain Bitcoin exposure in Canada appears to be hurting GBTC. Researcher Jan Wuestenfeld supports this thesis:(GBTC) trading at a discount since the beginning of march and their Bitcoin holdings have been stagnating. It looks like with new alternatives coming to the market investors might turn to other products to get exposure to Bitcoin

Grayscale investors have started to express discontent. Investment firm Marlton issued a press release on April 6, to call for Grayscale to take “immediate action to address GBTC’s significant discount to net asset value” (NAV).

In parallel, the Security and Exchange Commission (SEC) is under a lot of pressure to approve a Bitcoin ETF. The Commission has received over 6 petitions to approve a Bitcoin ETF in the U.S. in under 4 months. The discount in the GBTC suggests that investors are favoring products with better trading mechanisms. The performance of Canada’s BTC ETF could create even more pressure for the U.S. regulator. As we can now observe Purpose Bitcoin ETF has been growing with a recent inflow of 836,628 Bitcoin (BTC).

PURPOSE BTC ETF.PNG

That`s all for today folks.

Thank you for reading our Bitcoin weekly recap. Stay tuned as we will be publishing more newsletters on the following markets from Bitcoin, Ethereum - DeFi and Stablecoins.

MOBILEYOURLIFE TEAM

Bitcoin (BTC) Weekly recap. Week 12 & 13

Welcome to a new edition of the Bitcoin recap. Where we analyze the core stats and metrics on the Bitcoin Markets. We also touch base and cover the Institutional news.

Remember to subscribe to our Deep Tech newsletter here (https://www.mobileyourlife.com/) which we send on a weekly basis to our Investors & Audience, reviewing the trends and technologies we are working on our portfolio.

BITCOIN (BTC)

Bitcoin the last two weeks has been consolidating between 53K USD and 61K USD price per coin.

Having had a resistance levet at around USD 53,969 on March 16th, it continued to fluctuacte on that range up to USD 59,425 per Bitcoin on March 18th. From that date it begun a bearish trend which ended on USD 51,383 USD per bitcoin on March 25th where it prepared again for a bull run reaching levels ATH of USD 58,793 per bitcoin on March 29th 2021.

glassnode-studio_bitcoin-price (1).png
glassnode-studio_bitcoin-price-drawdown-from-ath (1).png

Taking a look on the percentage (%) of drawdown on the Bitcoin price from its ATH we can see that it went down to -0,1617 on March 25th when the price of Bitcoin decreased to USD 51,704. While the Bitcoin have been moving on the resistance levels mentioned above, one of the most important topics of discussion in Bitcoin and its ecosystem is the energy supply and how much it consumes electricity from non-renewable sources.

ARGO BLOCKCHAIN

Argo Blockchain (listed on the London stock exchange under $ARB) today announced the formation of a bitcoin mining pool powered exclusively by clean energy.

From the press release:

Terra Pool represents the first ever opportunity for the creation of 'green bitcoin'. The initiative aims to expedite the shift from conventional power to clean energy and reduce the impact of Bitcoin mining on the environment. The mining pool will provide a platform for cryptocurrency miners to produce Bitcoin and other cryptocurrencies in a sustainable way.

Peter Wall, Chief Executive of Argo Blockchain, said: "Addressing climate change is a priority for Argo and partnering with DMG to create the first 'green' Bitcoin mining pool is an important step towards protecting our planet now and for generations to come. We are hopeful other companies within the Bitcoin mining industry follow in our footsteps to demonstrate broader climate consciousness."

Dan Reitzik, Chief Executive of DMG, said: "DMG's increased innovative strength and continued focus on eco-friendly Bitcoin mining has the opportunity to drive transformations in how the Bitcoin mining community acts towards a climate-conscious future.

DMG's ongoing commitment to clean energy-based capital deployment is a key industry development. We believe this is an opportunity for continued growth as we develop a better understanding of climate-friendly operations while simultaneously integrating the newest and most innovative blockchain technologies."

Bitcoin mining currently uses 40% renewables or more, and that portion will likely grow substantially in the future.

BTC MINING REVENUE.PNG

Blockstream

Continuing the Bitcoin Mining updates and institutional companies. Bitcoin development company Blockstream is launching a token that is tied to the company’s Bitcoin mining production and which is redeemable in bitcoin. One Blockstream Mining Note (BMN) represents 2,000 terahashes per second of hashrate from one of Blockstream’s mining facilities. The first tranche of 62.5 BMN will go on sale next week, April 7, and can be redeemed after three years for the bitcoin equivalent to the total hashrate the note represents. Blockstream is issuing the token on its Liquid sidechain, a semi-privatized, trusted blockchain that runs in parallel with Bitcoin, and will sell it initially through a private token sale on STOKR. The first batch of tokens will go for £200,000 ($275,836) each, and there’s a purchase minimum of 1 BMN (payable in bitcoin, or BTC and USDT on the Liquid network).

Hashrate tokens

Hashrate tokens are a recent development in the Bitcoin derivatives market, lead by Bitcoin miner Poolin and the Binance exchange.

These contracts exist as a way for high-caliber investors to gain exposure to bitcoin and bitcoin mining without owning the bitcoin outright or fumbling with mining hardware. Typically, they are traded OTC before being integrated on exchanges.

glassnode-studio_bitcoin-mean-hash-rate.png

On the other hand and reviewing again the Bitcoin mean hash rate which as we mentioned last week is the computer power of the Bitcoin network. Which not only measure the speed but also the security of the network. On the second half of the month on March 14th reached a level of 174 EH/s.

Chicago Mercantile Exchange (CME)

Derivatives exchange Chicago Mercantile Exchange (CME) will launch smaller-sized bitcoin futures contracts in May, potentially expanding the number of people who bet on the future price of the leading cryptocurrency.

"The introduction of Micro Bitcoin futures responds directly to demand for smaller-sized contracts from a broad array of clients and will offer even more choice and precision in how participants can trade regulated bitcoin futures in a transparent and efficient manner at CME Group," Tim Court, CME Group global head of Equity Index and Alternative Investment Products, said in a press release.

FUTURE OPEN INTEREST

Open interest refers to the total amount of funds that are in open futures contracts. However, it does not show whether these funds are placed in long or short positions.

glassnode-studio_bitcoin-futures-open-interest-current (1).png

The surging price of bitcoin from the start of the year has resulted in massive growth in open interest for the asset’s futures as traders seek to hedge their positions on various exchanges. Data indicates by Glassnode that bitcoin futures open interest have grown by 133.74% between January and March 2021.

During the first week of January 2021, the open interest was valued at $9.66 billion, while as of March 30, 2021, the figure was $22.58 billion reflecting the asset’s sustained bull run in the first three months of the year.

glassnode-studio_bitcoin-futures-open-interest-all-exchanges (1).png

We also mention our Stock to Flow Deflection on Bitcoin. Which gives us an indicator if the price has been under or over valued. As we see in the graph below there was a short period during February according to this metric which showed Bitcoin (BTC) price was undervalued. Besides second week of January and third week of February, the price of Bitcoin has been overvalued.

glassnode-studio_bitcoin-stock-to-flow-deflection.png

Stock to Flow Ratio

This model treats Bitcoin as being comparable to commodities such as gold, silver or platinum. These are known as 'store of value' commodities because they retain value over long time frames due to their relative scarcity. It is difficult to significantly increase their supply i.e. the process of searching for gold and then mining it is expensive and takes time. Bitcoin is similar because it is also scarce. In fact, it is the first-ever scarce digital object to exist. There are a limited number of coins in existence and it will take a lot of electricity and computing effort to mine the 3 million outstanding coins still to be mined, therefore the supply rate is consistently low.

BTC STOCK TO FLOW RATIO.PNG

Stock-to-flow ratios are used to evaluate the current stock of a commodity (total amount currently available) against the flow of new production (amount mined that specific year). As you can see in the image above the indicator is targetting a price of Bitcoin (BTC) by the end of 2021 of approximately 100K USD and 1MM USD by the end of the decade (2029-2030).

For store of value (SoV) commodities like gold, platinum, or silver, a high ratio indicates that they are mostly not consumed in industrial applications. Instead, the majority is stored as a monetary hedge, thus driving up the stock-to-flow ratio. higher ratio indicates that the commodity is increasingly scarce - and therefore more valuable as a store of value.

BTC Futures perpetual funding rate

glassnode-studio_bitcoin-futures-perpetual-funding-rate-all-exchanges.png

Funding rates indicate the premium that futures traders have to pay (or receive) to keep a position open.

If the funding rate is positive, traders with an open long position have to pay a premium to keep the trade open. If the funding rate is negative, traders with a short position have to pay a premium to keep the trade open.

Historically, funding rates have tended to correlate with market sentiment. When the market is bullish or bearish, funding rates tend to be positive or negative, respectively.

During the whole month of March, funding rates have been increasing and decreasing rapidily from a 0.007% around March 5th to up 0.121% the week after. It went down again to 0.005% when it reset and increase in the current levels of 0.074%. The sentiment continues to be bullish and the recent drops in the funding rate during march indicated that it was preparing to bounce back as it did. As we can not the funding rates on each exchange it only went negative for OKEX and Bitfinex around mid March. The rest of the exchanges were positive rate during whole march.

glassnode-studio_bitcoin-futures-perpetual-funding-rate (1).png
glassnode-studio_bitcoin-grayscale-premium (1).png

INSTITUTIONS - GRAYSCALE & PURPOSE BTC ETF

According to Nasdaq Grayscale CEO Michael Sonnenshein said the crypto asset management company is taking a wait-and-see approach to filing for a bitcoin exchange-traded fund (ETF). The CEO, who took over Grayscale in January, suggested U.S. regulators still aren’t ready to approve a bitcoin ETF, even though Grayscale is preparing for such an eventuality.

Institutional investors continue to line up, he said, predicting the market remains in the “early days” of a corporate bitcoin adoption trend that may accelerate through 2021.

As we can see in the image below, GBTC premium indicator continues to go down with a new negative record of -14.34% on March 24th. This growth in discount can also be explained as Grayscale Investments gradually shifts focus to altcoins. As reported by news.Bitcoin.com, Grayscale added 174,000 litecoins or almost 80% of the newly minted LTC in February of 2021. Similarly, the investment company also added 243,000 ETH to its ethereum holdings during the same period.

On the other hand the rise of competitors to Grayscale such as the Purpose Bitcoin ETF since its launch in February 2021, grew from 6,036 Bitcoin up to more of 16,462 Bitcoin on March 31th. Most crypto enthusiasts according to Twitter, say that the launch of Purpose Bitcoin ETF has been the primary reason of Bitcoin Grayscale Premium going negative.

glassnode-studio_bitcoin-purpose-bitcoin-etf-flows.png

BITCOIN DIFFICULTY RIBBON

Created by Willy Woo is an indicator that uses simple moving averages (200d, 128d, 90d, 60d, 40d, 25d, 14d) of the Bitcoin mining difficulty to create the ribbon. Historically, periods when the ribbon compresses have been good buying opportunities.

The Diffiulty Ribbon speaks to the impact of miner selling pressure on Bitcoin`s price action. When network difficulty reduces its rate of climb, miners are going out of business, leaving only the strong miners who proportionally need to sell less of their coins to remain operational, this leads to less sell pressure and more room for bullish price action. The best times to buy Bitcoin are zones where the ribbon compresses. The ribbon consists of simple moving averages of Bitcoin network difficulty so the rate of change of difficulty can be easily seen.

We see how during march there were a few good moments to buy Bitcoin according to the indicator. As March 4th it was compressing more and the price of Bitcoin had a quick bull run from USD 48,515 to USD 61,217.

glassnode-studio_bitcoin-difficulty-ribbon.png

That`s all for today folks. Thank you for reading our Bitcoin weekly recap. Stay tuned as we will be publishing more newsletters on the following markets from Ethereum - DeFi and Stablecoins.

MOBILEYOURLIFE TEAM

Crypto Weekly Research - Week 11 2021

Welcome to our new edition of Crypto Weekly Research. This week we are going deeper on the Bitcoin Markets, Institutional news and core on-chain stats.

Hope you enjoy!

Bitcoin (BTC)

Bitcoin have had one of the most intense and strong weeks in terms of its price movements and stats. Coming out from a low point of approx USD 48,905 on March 7th. And having recovered from four corrections on its price. BTC reached an ATH price of USD 61,618 on March 13th before decreasing the price to USD 55,654 in 48 hours. And consequently going dow to USD 54,654 at the moment of this press release.

glassnode-studio_bitcoin-price (1).png

INSTITUTIONAL NEWS

Norwegian energy company, Aker ASA, has formed a new subsidiary dedicated to bitcoin. The subsidiary, Seetee, will hold all their liquid assets in BTC (currently ~$58mm worth), and will invest & participate in the Bitcoin ecosystem. Seetee plans to spin up bitcoin-mining operations and also intends to develop bitcoin-related software, based on Blockstream's products, and/or the Lightning network.

Billionaire Kjell Inge Røkke, Aker´s Chairman stated:

I am fascinated by the prospect of bitcoin lightning wallets that may enable instant credit via micropayments without the need to offer personal information that my counterpart can monetise without approval or compensation.

Coinbase

Cryptocurrency exchange Coinbase has reached an implied $68 billion valuation ahead of its highly anticipated direct listing on the Nasdaq. -Accordig to CNBC.

The company reported private shares trading at $343.58 apiece for the first quarter of 2021 ended March 15, which increases the company’s valuation 13-fold. The latest valuation is based on an average quarterly share price Coinbase cited in a revised S-1 filing released Wednesday.

According to PitchBook data, the company was last valued at $8 billion in October 2018.

The revised regulatory filing also shows that the company has more than 196 million shares outstanding for the first quarter of 2021, resulting in the latest valuation figure. Coinbase’s first filing in February showed the company reported a profit of $322 million last year on net revenue that more than doubled to $1.1 billion.

The rise of special purpose acquisition vehicles

A direct listing is an alternative to an IPO, and it involves investors and employees converting their ownership stakes into stock that’s listed on an exchange. Founders have become increasingly disenchanted with the IPO process in recent years, leading to a boom in direct listings and special purpose acquisition vehicles.

On the other hand CEO of Galaxy Digital Mike Novogratz told CNBC's "Squawk Box" Monday that Bitcoin will literally be like a report card for how citizens think the government is doing managing their finances," , "We're kind of in uncharted territories on how much money we are printing, and bitcoin is a report card on that."

Morgan Stanley

The investment bank told its financial advisors Wednesday in an internal memo that it is launching access to three funds that enable ownership of bitcoin. Two of the funds on offer are from Galaxy Digital, a crypto firm founded by Mike Novogratz, while the third is a joint effort from asset manager FS Investments and bitcoin company NYDIG.

COINBASE.png

ON-CHAIN MARKET INDICATORS

It is important to note as well, that the number of new addresses that appeared for the first time in a transaction on the Bitcoin network increased in the last 24h up to 22,293, according to a 24h moving average and reaching the active address on the Bitcoin network to 62,318.

glassnode-studio_bitcoin-number-of-new-addresses.png
glassnode-studio_bitcoin-number-of-addresses.png

TOTAL BTC ADDRESSES

The trend continue to be bullish but it is also worth noting how both in the correction of Bitcoin (BTC) during December 2017 and January 2018 decreased the new addresses indicator similar to this last week of march 2021. Although the trend of total addresses reaches more of 795 MM of Bitcoin Wallets addresses. (See graph on the left)

Bitcoin Mean Hash Rate

On the other hand the Bitcoin mean hash rate have been increasing the whole Q1 2021. Reaching also an all time high (ATH) of 176 EH/s hashes per second on february 5th when BTC price was on USD 38,123. The reason we mention it, is because it shows a healthy and positive sign on the Bitcoin network. At a high hash rate it means the Bitcoin network is more secure from 51- percent attacks. The Bitcoin hash rate is the computer power of the Bitcoin network. It is how we can measure the speed at which the bitcoin network processes data when adding new transactions to the shared ledger.

glassnode-studio_bitcoin-mean-hash-rate (1).png

Bitcoin Miner revenue

glassnode-studio_bitcoin-total-miner-revenue-all-miners (4).png

Q1 2021 - ALL TIME HIGH REVENUE

Similar to the increase on the number of wallets and bitcoin mean hash rate. The Bitcoin miner revenue generated over 1 billion USD in January 2021 having its all time high of BTC 1,234 on January 6th 2021. Since its ATH back in December 2017. At the time, the miners made more than USD 1,25 billion. You can also note in grahp II below, how BTC miner revenue not only when down after December 2017, but also was cut by half back in May 2020 after the Bitcoin Halving event. And why is so important this new ATH back in January 2021.

glassnode-studio_bitcoin-total-miner-revenue-all-miners (5).png

Bitcoin Grayscale Premium

glassnode-studio_bitcoin-grayscale-premium (2).png

The Bitcoin Grayscale Premium which we mentioned last week it continued trading at a discount as you see in graph below. We said that also this indicator going negative was a reset for a fresh bull run. Which reached a peak of 61,000 USD per BTC but it went dow again last week and it continues on -7.1% to NAV.

Stock to Flow Ratio

The Stock to Flow (S/F) Ratio is a popular model that assumes that scarcity drives value. Stock to Flow is defined as the ratio of the current stock of a commodity (i.e. circulating Bitcoin supply) and the flow of new production (i.e. newly mined bitcoins). Bitcoin's price has historically followed the S/F Ratio and therefore it is a model that can be used to predict future Bitcoin valuations. As you can notice from the graph the Stock to Flow Ratio by the end of 2021 it is approximately 100K USD.

glassnode-studio_bitcoin-stock-to-flow-ratio.png
glassnode-studio_bitcoin-stock-to-flow-deflection.png

Deflection Ratio

Now the following indicator, The Stock to Flow (S/F) Deflection is the ratio between the current Bitcoin price and the S/F Model. If deflection is ≥ 1 it means that Bitcoin is overvalued according to the S/F model, otherwise undervalued. Which we can notice according to the graph in the left, is that the ratio both in January when we saw that Bitcoin miner revenue and Hash rate reached ATH the deflection was ≥ 1. (Red colour) Also we see the same trend in February 2021. Which could be interpreted that Bitcoin potentially was overvalued.

glassnode-studio_bitcoin-net-realized-profit-loss (1).png

A data metric called NRPL (Net Realized Profit/Loss) shows that people have been taking profits – with the metric dropping negative for the first time since September 2020.Green indicates selling at a profit and red indicates selling at a loss.

glassnode-studio_bitcoin-net-unrealized-profit-loss-nupl.png

By identifying which stage of the market cycle we are currently in, the NUPL indicator can help traders to set entries and identify exit points. For instance, a trader may want to go long on bitcoin when the NUPL indicator suggests that a move from the capitulation phase to the hope-fear phase is completed, and then to take profits once the market enters the belief-denial phase. (see graph on the left, which shows we have been since october in the Belief-Denial phase).

The weakness of the NUPL indicator, as with all on-chain metrics, is that bitcoins transacted off-chain are not accounted for and therefore is an incomplete picture of profits and losses. Nevertheless, the NUPL indicator has been accurate since 2010 in identifying market tops, and to a lesser extent, bottoms. Here in graph below you can check the indicator from September 2017 where we can observe the 2 main capitulation phases of Bitcoin (BTC) in December 2018 coming from the Euphoria in December 2017 to March 2020 when the pandemic of COVID19 start affecting most of our planet and the markets.

glassnode-studio_bitcoin-net-unrealized-profit-loss-nupl (1).png

BTC FUTURES

glassnode-studio_bitcoin-futures-open-interest-all-exchanges (1).png

FUTURES OPEN INTEREST

In the meantime, futures open curiosity reached a $22.5 billion record-high, inflicting traders to query how sustainable the present rally is. According to data from crypto derivatives analytics site Glassnode, bitcoin futures open interest on major retail platforms reached new all-time highs over the weekend.

glassnode-studio_bitcoin-futures-open-interest.png

On the institution-driven CME’s bitcoin futures contract, however, open interest was lower compared with levels at the end of February, when bitcoin’s price pierced $58,000 for the first time. After peaking at $58,300 on Feb. 21, Bitcoin confronted a 26% correction over the next week. That transfer worn out over $4.5 billion price of futures contracts, due to this fact just about eliminating any extreme patrons’ leverage, which was confirmed by the annualized premium on the 1-month futures contract dropping to 17%

These betting that Bitcoin worth will attain $65,000 and above might be happy to know that open curiosity has been rising all through the 71% rally since February. This example signifies short-sellers are probably totally hedged, taking good thing about the futures premium as a substitute of successfully anticipating a draw back. Skilled traders are basically doing money and carry trades that consist of shopping for the underlying asset and concurrently promoting futures contracts.

These arbitrage positions normally don’t current liquidation dangers. Due to this fact, the present surge in open curiosity throughout a powerful rally is a constructive indicator.

glassnode-studio_bitcoin-futures-volume.png

Bitcoin: Market Cap to Thermocap Ratio

The Market Cap to Thermocap Ratio is simply defined as Market cap / Thermocap, and can be used to assess if the asset's price is currently trading at a premium with respect to total security spend by miners. The ratio is adjusted to account for the increasing circulating supply over time. Which suggest that the gains are only getting started and a top is still far off.

On-chain data below show that BTC can skyrocket 135% further from the current levels thereby smashing past $100,000 levels. Glassnode CTO and co-founder Rafael Schultze-Kraft state that the Bitcoin marketcap to thermocap ratio suggests that BTC can shot 135% from the current levels.

The last time Bitcoin (BTC) was at the same MC/TC ratio it was trading close to $8500 levels, post which it surged 135% higher. So if Bitcoin (BTC) follows a similar growth now, it can shoot past $100K levels.

MarketCap Bitcoin.PNG

That`s all for today folks. Thank you for reading our Bitcoin weekly recap. Stay tuned as we will be publishing more newsletters on the following markets from Ethereum - DeFi and Stablecoins.

MobileyourLife Team

ShipinSpace

ShipinSpace

A few weeks ago, we published an article that covered the proposal of ShipinSpace, an England-based project led by Fabrizio Boer that designed a heavy-duty cargo transportation method that can couple to space launchers that are currently in use.

We believe that their proposal has great potential to shift the near future of space exploration and, eventually, settlement, so we decided to dive deeper into the details of their project in our most recent research release. You can find it by clicking the image below, or visit our Research page to find this and all our previous releases.

Mining Power – The New Generation of GPUs

Mining Power – The New Generation of GPUs

Given the constant improvements and releases of new and better architectures in the last couple of years and the recent launch of a new generation of cards by the top manufacturers in the industry (Nvidia and AMD), we will dedicate a piece to explain how exactly are GPUs more efficient than regular CPUs for the mining process, how past launches affected the state of the market, and how the current generation might be the fuel needed for the predicted bullish run that may come in the next months.

Central Bank Digital Currencies - The Future of Money?

Central Bank Digital Currencies - The Future of Money?

Since the appearance of Bitcoin in 2008 with the Satoshi Nakamoto paper called Electronic Cash System. It emerged a new force into the financial system that governments, private companies and society were not aware of their implications for the future of our economy. This has motivated multiple governments to focus on the implementation of Central Bank-issued Digital Currencies.