
Welcome to our new edition of Crypto Weekly Research. This week we are going deeper on the Bitcoin Markets, Institutional news and core on-chain stats.
Hope you enjoy!
Bitcoin (BTC)
Bitcoin have had one of the most intense and strong weeks in terms of its price movements and stats. Coming out from a low point of approx USD 48,905 on March 7th. And having recovered from four corrections on its price. BTC reached an ATH price of USD 61,618 on March 13th before decreasing the price to USD 55,654 in 48 hours. And consequently going dow to USD 54,654 at the moment of this press release.

INSTITUTIONAL NEWS
Norwegian energy company, Aker ASA, has formed a new subsidiary dedicated to bitcoin. The subsidiary, Seetee, will hold all their liquid assets in BTC (currently ~$58mm worth), and will invest & participate in the Bitcoin ecosystem. Seetee plans to spin up bitcoin-mining operations and also intends to develop bitcoin-related software, based on Blockstream's products, and/or the Lightning network.
Billionaire Kjell Inge Røkke, Aker´s Chairman stated:
— I am fascinated by the prospect of bitcoin lightning wallets that may enable instant credit via micropayments without the need to offer personal information that my counterpart can monetise without approval or compensation.
Coinbase
Cryptocurrency exchange Coinbase has reached an implied $68 billion valuation ahead of its highly anticipated direct listing on the Nasdaq. -Accordig to CNBC.
The company reported private shares trading at $343.58 apiece for the first quarter of 2021 ended March 15, which increases the company’s valuation 13-fold. The latest valuation is based on an average quarterly share price Coinbase cited in a revised S-1 filing released Wednesday.
According to PitchBook data, the company was last valued at $8 billion in October 2018.
The revised regulatory filing also shows that the company has more than 196 million shares outstanding for the first quarter of 2021, resulting in the latest valuation figure. Coinbase’s first filing in February showed the company reported a profit of $322 million last year on net revenue that more than doubled to $1.1 billion.
The rise of special purpose acquisition vehicles
A direct listing is an alternative to an IPO, and it involves investors and employees converting their ownership stakes into stock that’s listed on an exchange. Founders have become increasingly disenchanted with the IPO process in recent years, leading to a boom in direct listings and special purpose acquisition vehicles.
On the other hand CEO of Galaxy Digital Mike Novogratz told CNBC's "Squawk Box" Monday that Bitcoin will literally be like a report card for how citizens think the government is doing managing their finances," , "We're kind of in uncharted territories on how much money we are printing, and bitcoin is a report card on that."
Morgan Stanley
The investment bank told its financial advisors Wednesday in an internal memo that it is launching access to three funds that enable ownership of bitcoin. Two of the funds on offer are from Galaxy Digital, a crypto firm founded by Mike Novogratz, while the third is a joint effort from asset manager FS Investments and bitcoin company NYDIG.

ON-CHAIN MARKET INDICATORS
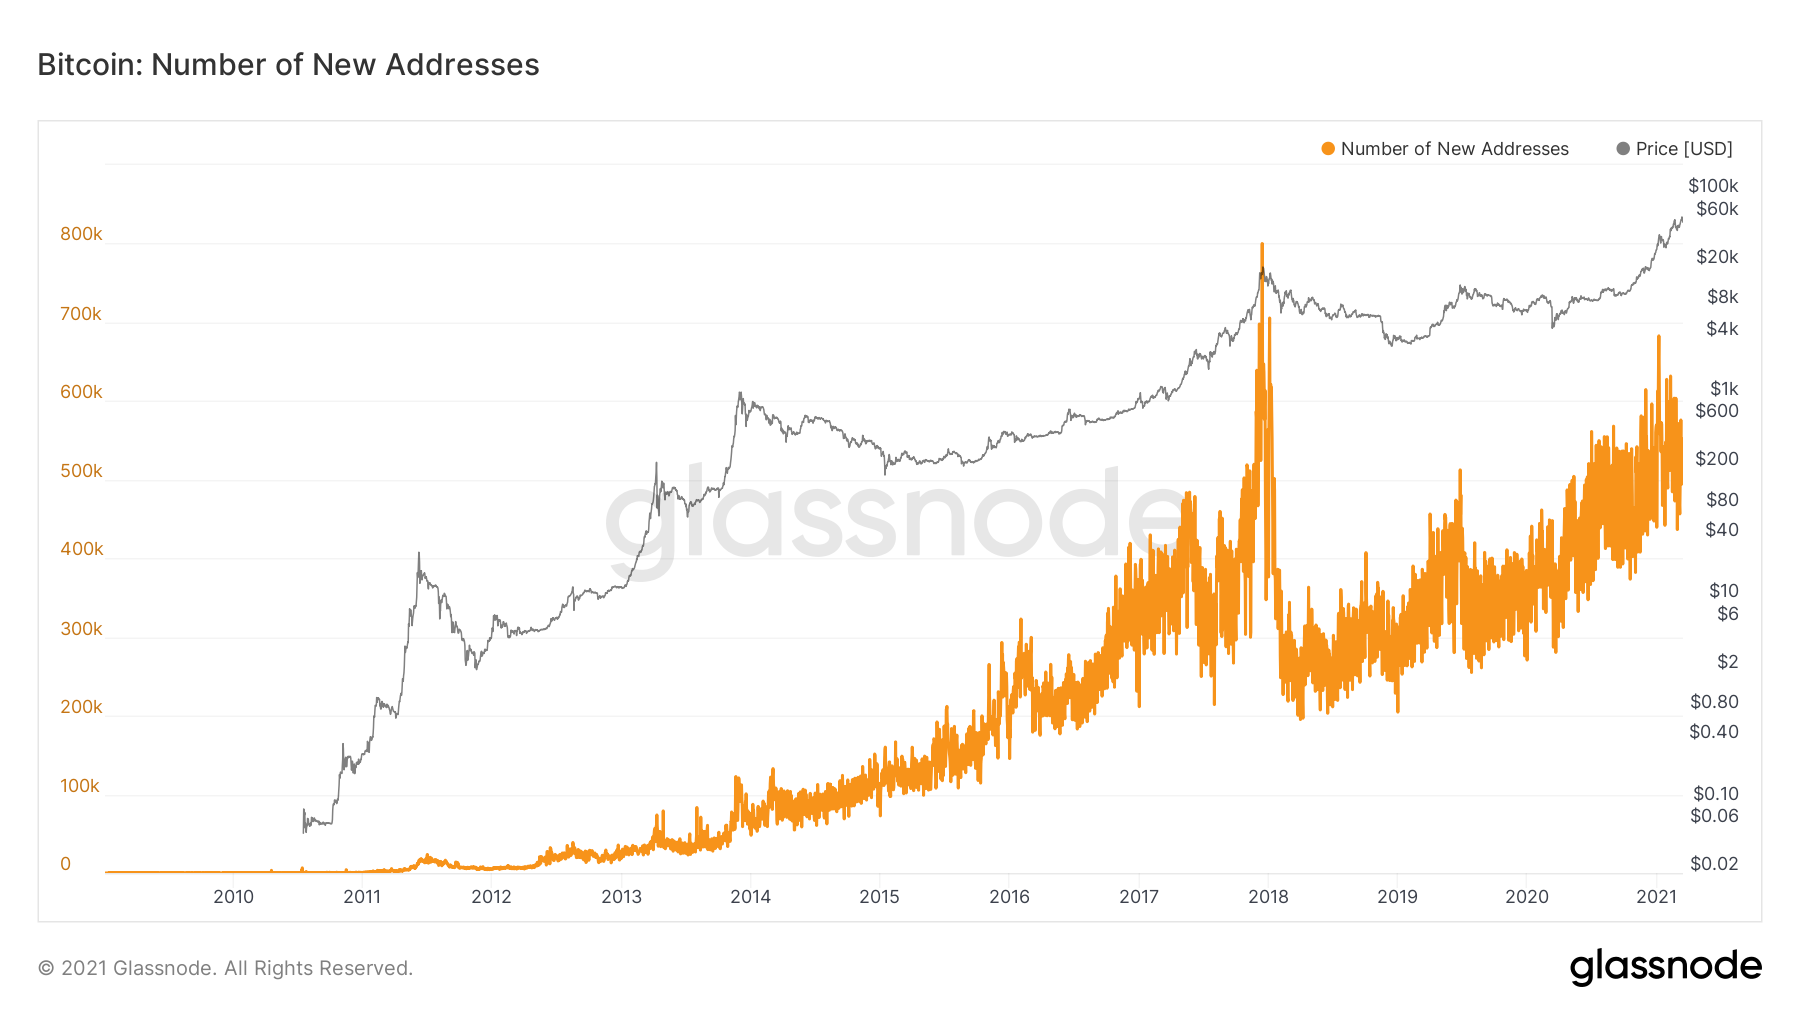
It is important to note as well, that the number of new addresses that appeared for the first time in a transaction on the Bitcoin network increased in the last 24h up to 22,293, according to a 24h moving average and reaching the active address on the Bitcoin network to 62,318.

TOTAL BTC ADDRESSES
The trend continue to be bullish but it is also worth noting how both in the correction of Bitcoin (BTC) during December 2017 and January 2018 decreased the new addresses indicator similar to this last week of march 2021. Although the trend of total addresses reaches more of 795 MM of Bitcoin Wallets addresses. (See graph on the left)
Bitcoin Mean Hash Rate
On the other hand the Bitcoin mean hash rate have been increasing the whole Q1 2021. Reaching also an all time high (ATH) of 176 EH/s hashes per second on february 5th when BTC price was on USD 38,123. The reason we mention it, is because it shows a healthy and positive sign on the Bitcoin network. At a high hash rate it means the Bitcoin network is more secure from 51- percent attacks. The Bitcoin hash rate is the computer power of the Bitcoin network. It is how we can measure the speed at which the bitcoin network processes data when adding new transactions to the shared ledger.

Bitcoin Miner revenue

Q1 2021 - ALL TIME HIGH REVENUE
Similar to the increase on the number of wallets and bitcoin mean hash rate. The Bitcoin miner revenue generated over 1 billion USD in January 2021 having its all time high of BTC 1,234 on January 6th 2021. Since its ATH back in December 2017. At the time, the miners made more than USD 1,25 billion. You can also note in grahp II below, how BTC miner revenue not only when down after December 2017, but also was cut by half back in May 2020 after the Bitcoin Halving event. And why is so important this new ATH back in January 2021.

Bitcoin Grayscale Premium

The Bitcoin Grayscale Premium which we mentioned last week it continued trading at a discount as you see in graph below. We said that also this indicator going negative was a reset for a fresh bull run. Which reached a peak of 61,000 USD per BTC but it went dow again last week and it continues on -7.1% to NAV.
Stock to Flow Ratio
The Stock to Flow (S/F) Ratio is a popular model that assumes that scarcity drives value. Stock to Flow is defined as the ratio of the current stock of a commodity (i.e. circulating Bitcoin supply) and the flow of new production (i.e. newly mined bitcoins). Bitcoin's price has historically followed the S/F Ratio and therefore it is a model that can be used to predict future Bitcoin valuations. As you can notice from the graph the Stock to Flow Ratio by the end of 2021 it is approximately 100K USD.


Deflection Ratio
Now the following indicator, The Stock to Flow (S/F) Deflection is the ratio between the current Bitcoin price and the S/F Model. If deflection is ≥ 1 it means that Bitcoin is overvalued according to the S/F model, otherwise undervalued. Which we can notice according to the graph in the left, is that the ratio both in January when we saw that Bitcoin miner revenue and Hash rate reached ATH the deflection was ≥ 1. (Red colour) Also we see the same trend in February 2021. Which could be interpreted that Bitcoin potentially was overvalued.

A data metric called NRPL (Net Realized Profit/Loss) shows that people have been taking profits – with the metric dropping negative for the first time since September 2020.Green indicates selling at a profit and red indicates selling at a loss.

By identifying which stage of the market cycle we are currently in, the NUPL indicator can help traders to set entries and identify exit points. For instance, a trader may want to go long on bitcoin when the NUPL indicator suggests that a move from the capitulation phase to the hope-fear phase is completed, and then to take profits once the market enters the belief-denial phase. (see graph on the left, which shows we have been since october in the Belief-Denial phase).
The weakness of the NUPL indicator, as with all on-chain metrics, is that bitcoins transacted off-chain are not accounted for and therefore is an incomplete picture of profits and losses. Nevertheless, the NUPL indicator has been accurate since 2010 in identifying market tops, and to a lesser extent, bottoms. Here in graph below you can check the indicator from September 2017 where we can observe the 2 main capitulation phases of Bitcoin (BTC) in December 2018 coming from the Euphoria in December 2017 to March 2020 when the pandemic of COVID19 start affecting most of our planet and the markets.

BTC FUTURES
FUTURES OPEN INTEREST
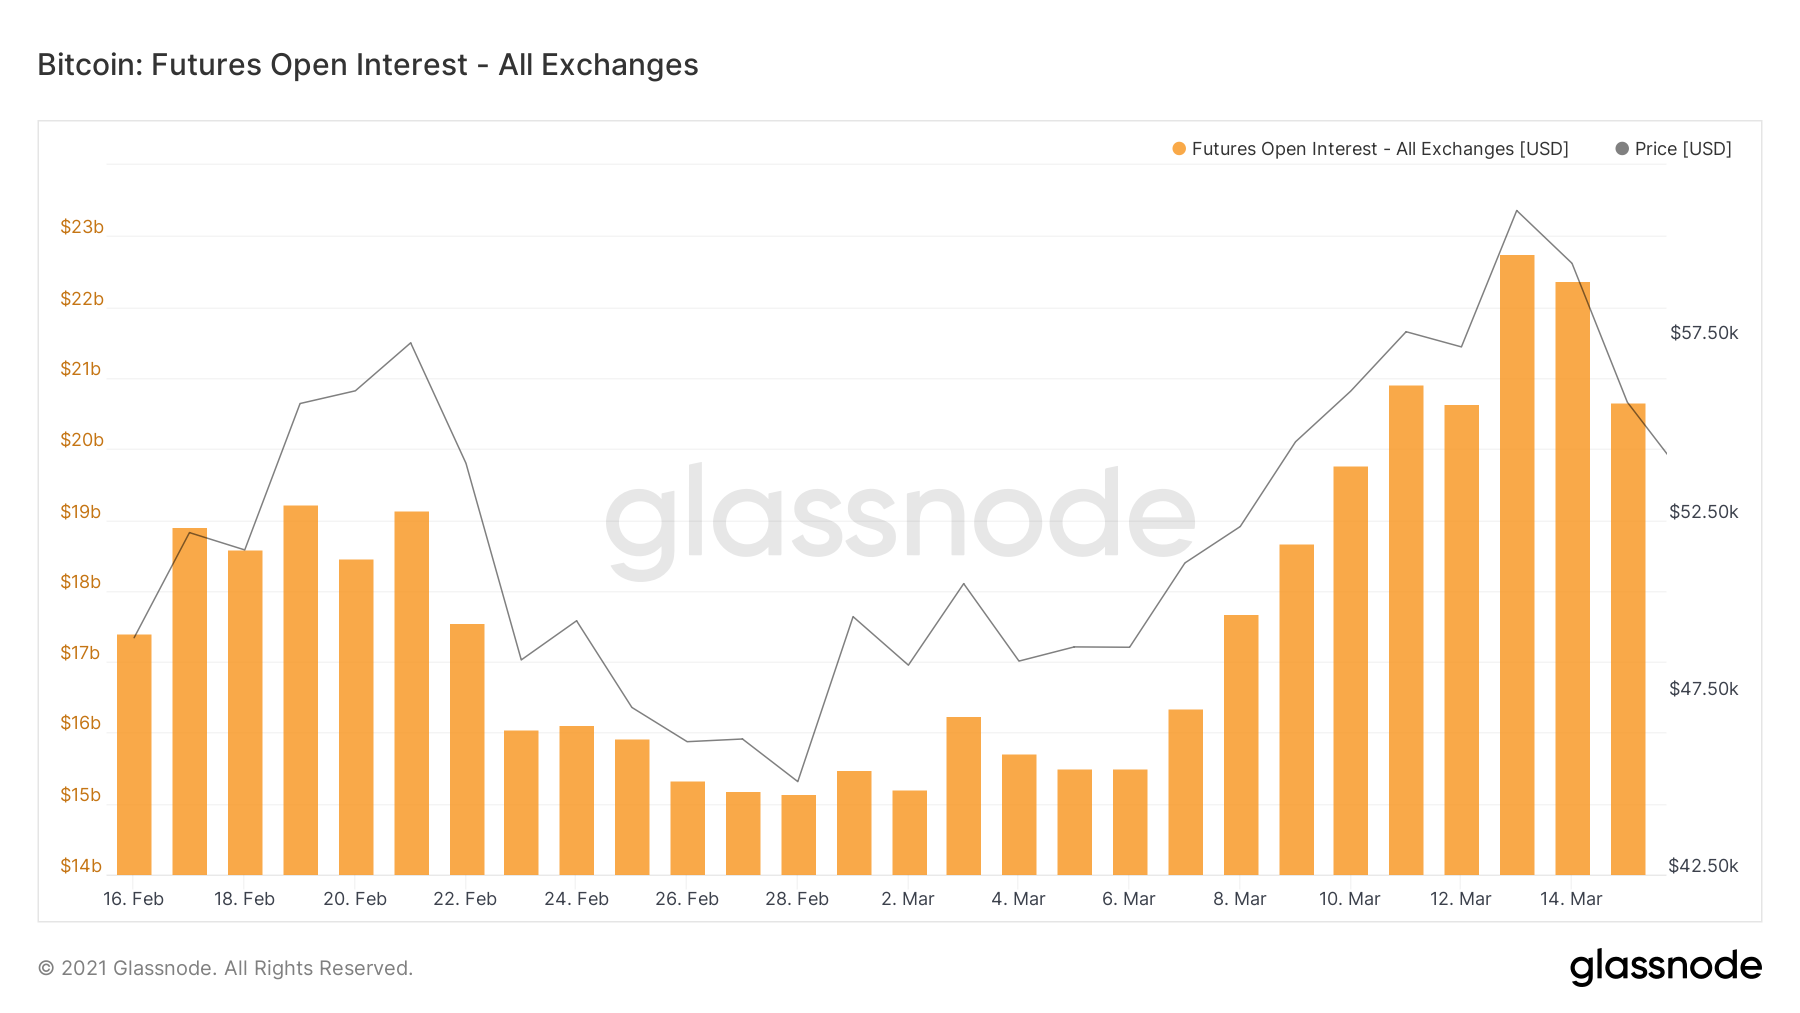
In the meantime, futures open curiosity reached a $22.5 billion record-high, inflicting traders to query how sustainable the present rally is. According to data from crypto derivatives analytics site Glassnode, bitcoin futures open interest on major retail platforms reached new all-time highs over the weekend.
On the institution-driven CME’s bitcoin futures contract, however, open interest was lower compared with levels at the end of February, when bitcoin’s price pierced $58,000 for the first time. After peaking at $58,300 on Feb. 21, Bitcoin confronted a 26% correction over the next week. That transfer worn out over $4.5 billion price of futures contracts, due to this fact just about eliminating any extreme patrons’ leverage, which was confirmed by the annualized premium on the 1-month futures contract dropping to 17%
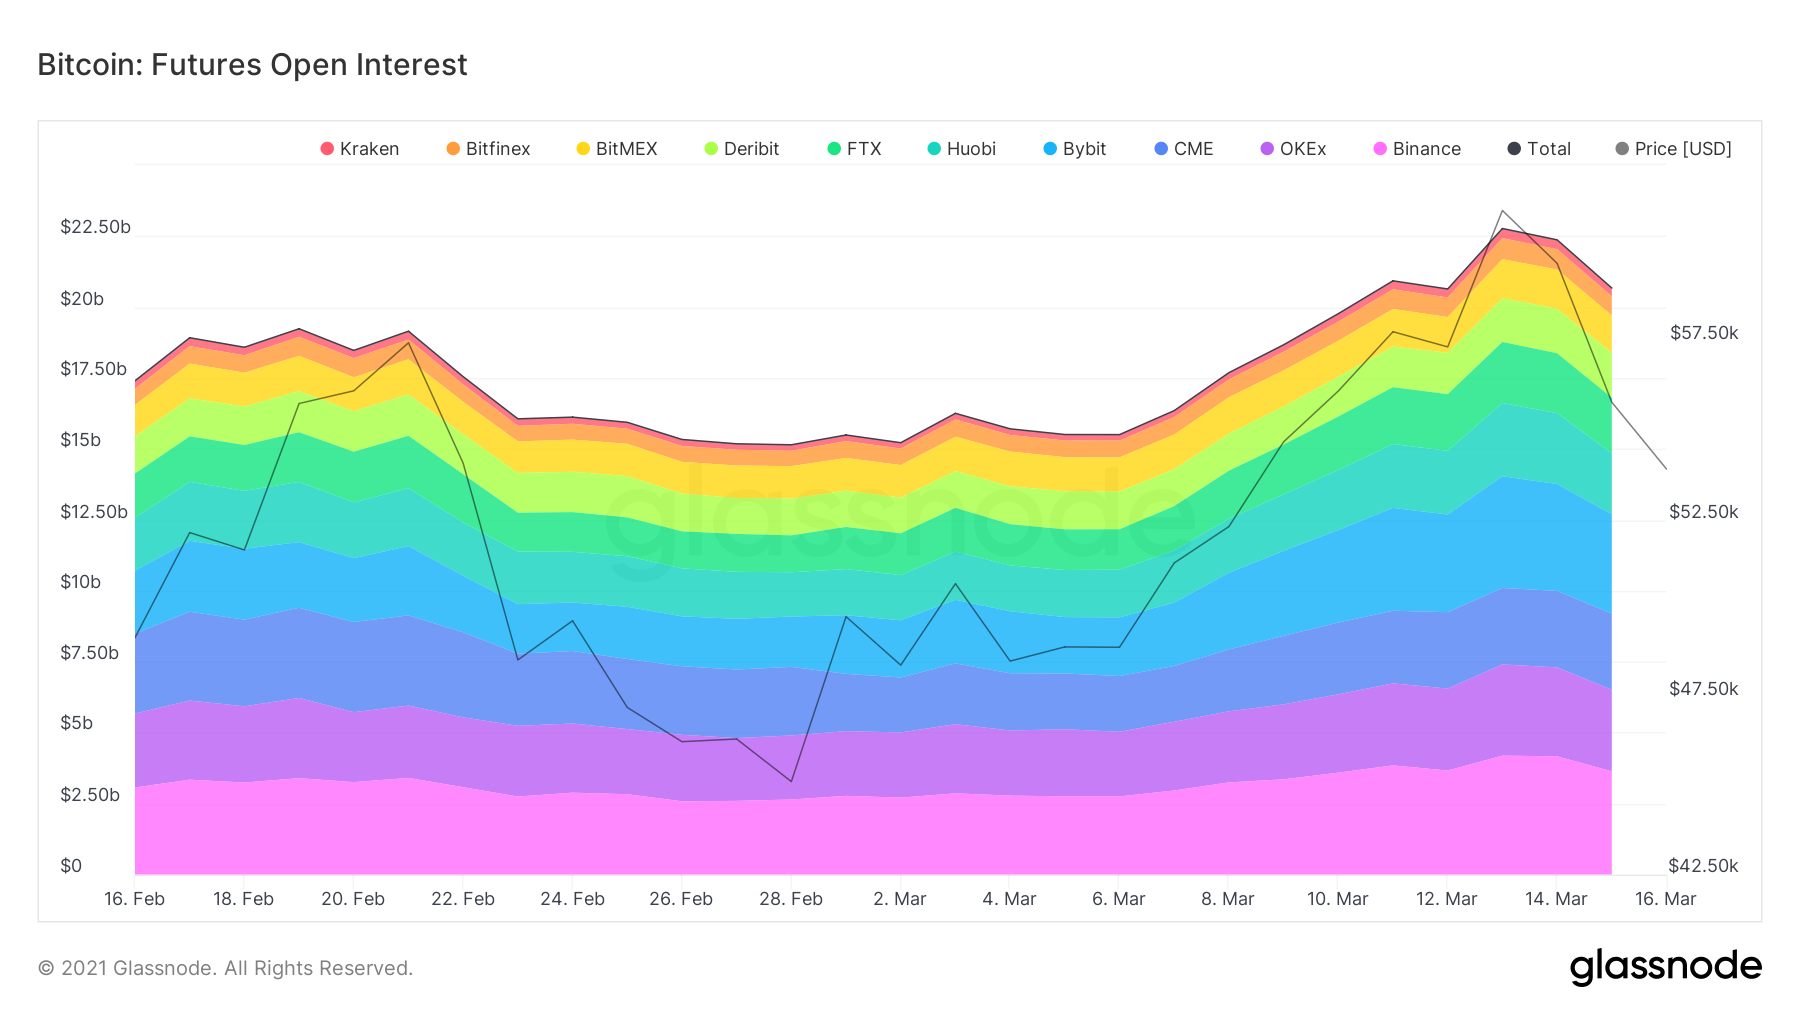
These betting that Bitcoin worth will attain $65,000 and above might be happy to know that open curiosity has been rising all through the 71% rally since February. This example signifies short-sellers are probably totally hedged, taking good thing about the futures premium as a substitute of successfully anticipating a draw back. Skilled traders are basically doing money and carry trades that consist of shopping for the underlying asset and concurrently promoting futures contracts.
These arbitrage positions normally don’t current liquidation dangers. Due to this fact, the present surge in open curiosity throughout a powerful rally is a constructive indicator.
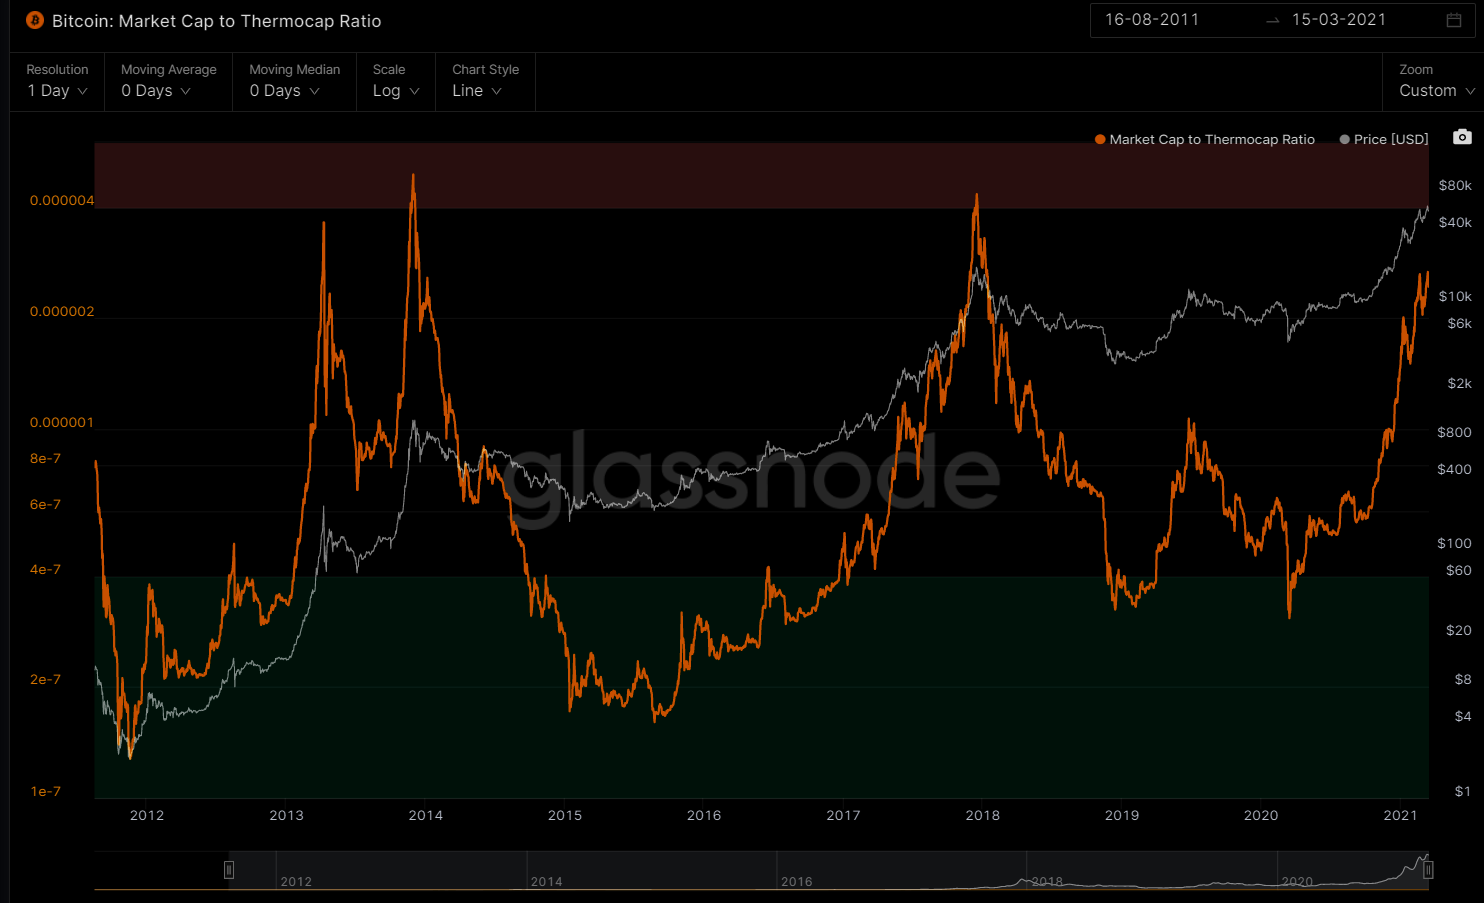
Bitcoin: Market Cap to Thermocap Ratio
The Market Cap to Thermocap Ratio is simply defined as Market cap / Thermocap, and can be used to assess if the asset's price is currently trading at a premium with respect to total security spend by miners. The ratio is adjusted to account for the increasing circulating supply over time. Which suggest that the gains are only getting started and a top is still far off.
On-chain data below show that BTC can skyrocket 135% further from the current levels thereby smashing past $100,000 levels. Glassnode CTO and co-founder Rafael Schultze-Kraft state that the Bitcoin marketcap to thermocap ratio suggests that BTC can shot 135% from the current levels.
The last time Bitcoin (BTC) was at the same MC/TC ratio it was trading close to $8500 levels, post which it surged 135% higher. So if Bitcoin (BTC) follows a similar growth now, it can shoot past $100K levels.
That`s all for today folks. Thank you for reading our Bitcoin weekly recap. Stay tuned as we will be publishing more newsletters on the following markets from Ethereum - DeFi and Stablecoins.