WELCOME TO OUR BITCOIN (BTC) RESEARCH FOR Q3 2021. WHERE WE GO DEEP IN THE TECHNICAL ANALYSIS OF THE MAIN BITCOIN METRICS AND STATS. FROM CORE ACTIVITY ONCHAIN TO DERIVATIVES AND BITCOIN FUTURES, EXCHANGE ACTIVITY AND INSTITUTIONAL DEALFLOW (GRAYSCALE PREMIUM AND MUCH MORE)
WE ALSO GO IN DETAIL TO MAJOR BITCOIN INDICATORS THAT HELPS US UNDERSTAND THE SWINGS OF THE MARKETS AND WHERE ARE HEADING FOR LAST QUARTER (Q4 2021). SUCH AS BITCOIN DIFFICULTY RIBBON AND RIBBON COMPRESSION, BITCOIN HODLERS ACTIVITY AND WALLET MOVEMENT.
REMEMBER TO SUBSCRIBE TO OUR DEEP TECH NEWSLETTER THAT WE SEND TO OUR INVESTORS ANALYZING THE MARKETS, COMPANIES IN OUR PORTFOLIO AND MUCH MORE.
Bitcoin Q3 2021
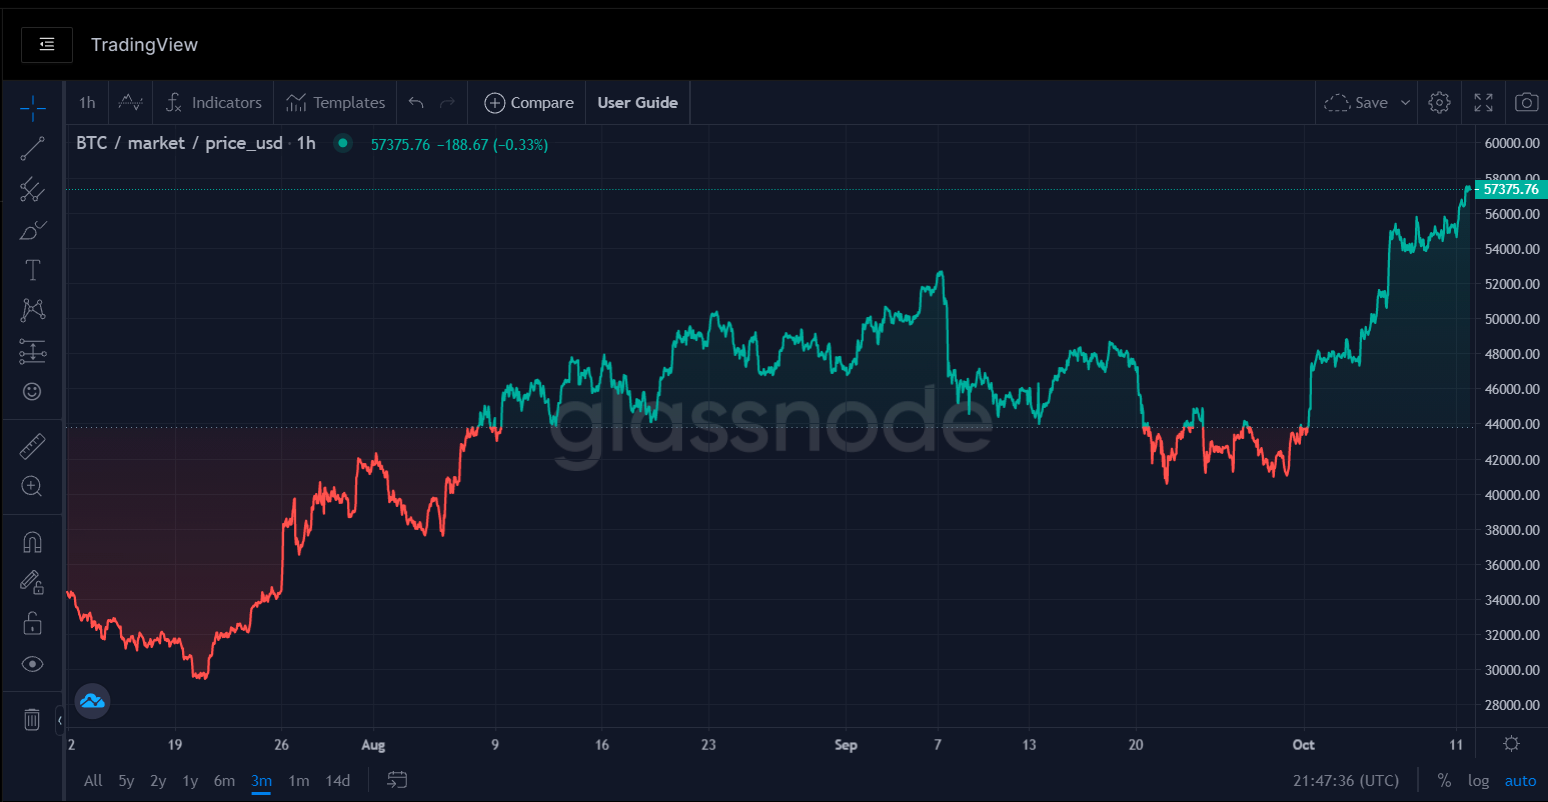
Bitcoin over the last 3 months have recovered the bullish trend it had at the beggining of the year.
Bouncing back from the bearish trend that started back in April 13th when the price of BTC went down from 63,688 USD to 31,428 USD on June 21th.
On Q3 2021 the price of BTC was a on a sideway trading behaviour and continued the bearish trend. The price was around 34,283 USD when it decreased down to 29,351 USD on July 20th, reaching the lowest point on Q3 2021.
From there, it started a strong bullish signal in the Bitcoin price. Reaching on July an ATH of 41,965 USD. Starting the month of August it decreased to a new resistance level of 37,485 USD. From that level and almost to the end of the month on August 23th BTC reached a new all time high of 50,103 USD. In the month of September it reached a new ATH price of 52,665 USD.
It rapidly decreased down to 40,368 USD creating a new resistance level for the quarter and for September where it stayed in a sideway market up to October 1st. By then it started again the bullish trend on October 6th to 55,419 USD and currently trading over 57K USD at the time of press release.
One of the several factors that led this massive crypto bullish trend was the U.S. Fed Chair Jerome Powell reassuring investors that the central bank has no plans to ban crypto. Institutional interest also spiked on mounting speculation that the U.S. Securities and Exchanges Commission (SEC) will approve a BTC ETF in the future months. On the other hand Bitcoin Futures on the Chicago Mercantile Exchange (CME) traded at their highest premium against spot since mid-April, which leads to suggest the rise on institutional demand for crypto exposure.
BTC WALLETS
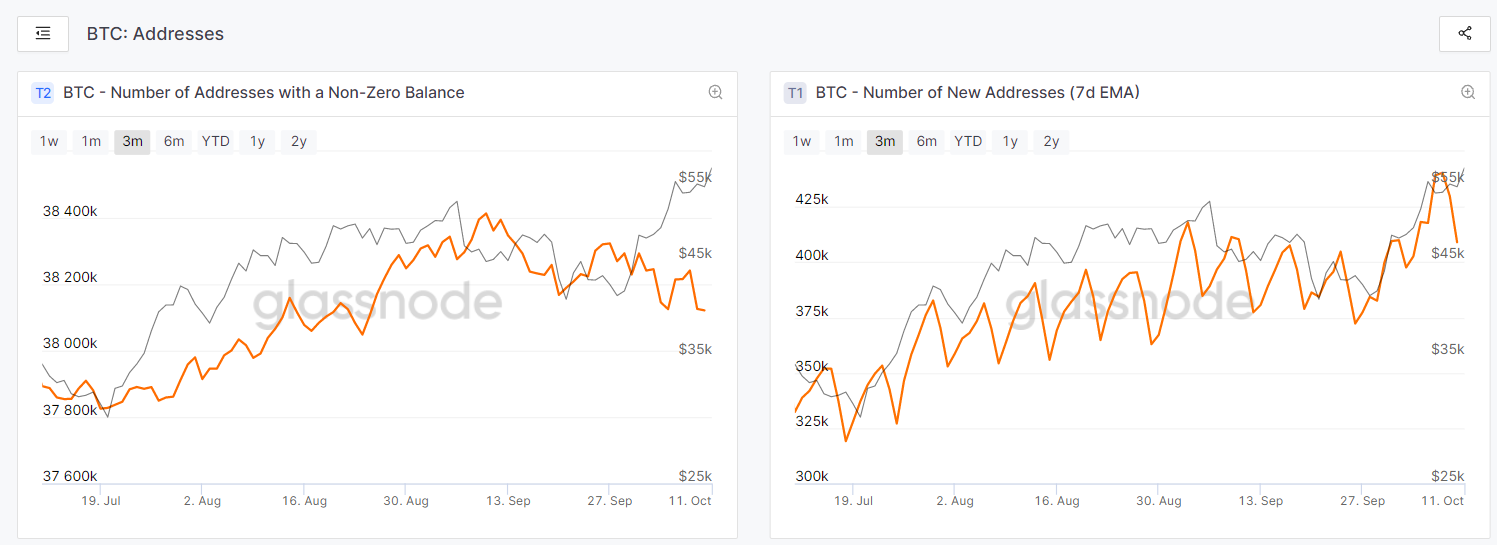
Over the last quarter the number of addresses holding a positive (non-zero) amount of coins have been increasing the whole 3rd quarter of the year. Only in September we saw a slight decline going from 38.4 MM addresses to 38.1 MM Addresses holding a positive balance. Despite that slight decline, it is still a bullish curve and an organic growth on the amount of Bitcoin Wallets. On the other hand the number of new Bitcoin (BTC) addresses created, increased during July, August and September from 342,000 new addresses to 399,000 addresses. The creation of new wallets clearly denotes the continuing global adoption of crypto and more users acquiring coins and getting started with the technology.
BTC WHALES
When it comes to the Bitcoin whales, who refers to individuals or entities that hold enough cryptocurrency that they have the potential to manipulate currency valuations. Their movement have outsized impacts on the bitcoin market, either through increased volatility, decreased liquidity or a combination of both.
According to BitInfoCharts, just three bitcoin wallets owned 3.07% of all the bitcoin in circulation as of Q2 2021 with a value of just around $27.8 billion, and the top 100 wallets held around 18% of all bitcoin valued at around $150 billion.
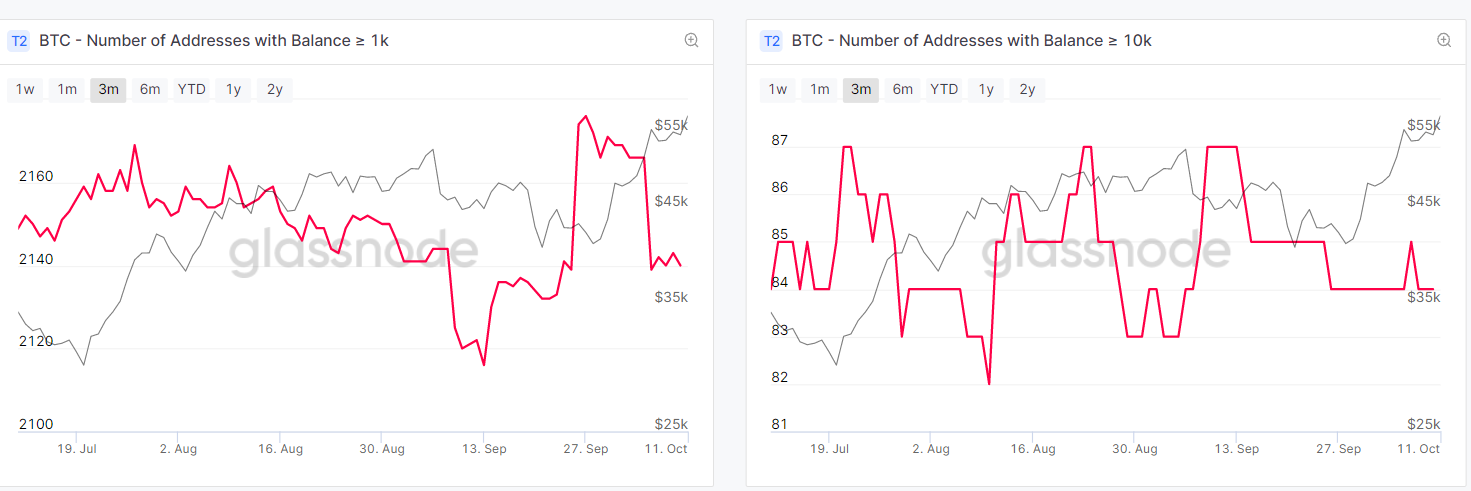
We can note that BTC addresses with balance higher of 10 BTC and 100 BTC have been increasing during the last month of September, which indicates and support the bullish trend. Also BTC wallets higher of 1K increased during the month of September from 2129 wallets to 2160. Wallets with balance higher of 10K BTC have been keeping a stable balance around 84 Bitcoin wallets.
Whales can be a problem for bitcoin because of the concentration of wealth, particularly if it sits unmoved in an account and lowers liquidity, which, in turn, can increase price volatility. Volatility is further increased if the whale moves a large quantity of bitcoin at once. If the seller is trying to sell bitcoin for state currency, the lack of liquidity and large transaction size could put downward pressure on the price of bitcoin, as other market participants see the transaction and also try to sell, creating a fire sale.
BTC HODL WAVES & REALIZED CAP
When observing the behaviour of HODLERS and how the Bitcoin Investors according to their age are moving the coins in the network we can denote the following trend in the 1st semester of 2021.
Long term investors (smart money) holding their Bitcoin (BTC) in the range of 7-10 years which represents together almost 18% of the population of investors. Maintained a steady balance during the first 6 months of 2021. That could be interpreted as sophisticated investors both individual and institutional that understand the value of the network and the value of Bitcoin as a long term asset which expect a higher ROI by the end of the year or in the long term.
Similar behaviour occurred for investors holding their coins in the range fo 1-7 years. Representing almost 37% of the population at the beggining of 2021. The investors between 1-2 years went down from 10.34% in January 2021 to 8.92% representing a small sell of their Bitcoin Holdings.
The major movement occurred for investors holding their coins between 6-12 months which increased from 7.7% up to 19.7% which provides a signal of short term buyers trying to gain more coins during the bullish trend.
BTC CORE CHAIN
Within the metrics of the network. We always want to touch base on the Bitcoin Mean Hash Rate. Which is a core indicator of the security and compute power in the network, in this case in a Proof of Work network. The Higher the rate it means a stronger and more secure environment.
BTC mean Hash Rate is a strong indicator that helps us understand the price of Bitcoin. With the recent China Crackdown of Bitcoin Miners and several attacks in the network the Hash Rate was compromised but it has bounced back very quickly.
Bitcoin mining was greatly affected between the months of May and June when China banned Bitcoin mining. However, it now seems that mining operations have fully recovered from this ordeal and miners have gone back to earn lucrative rewards.
The Chinese crackdown on mining caused a short-term disruption in the network, and the hashrate dropped to record lows.
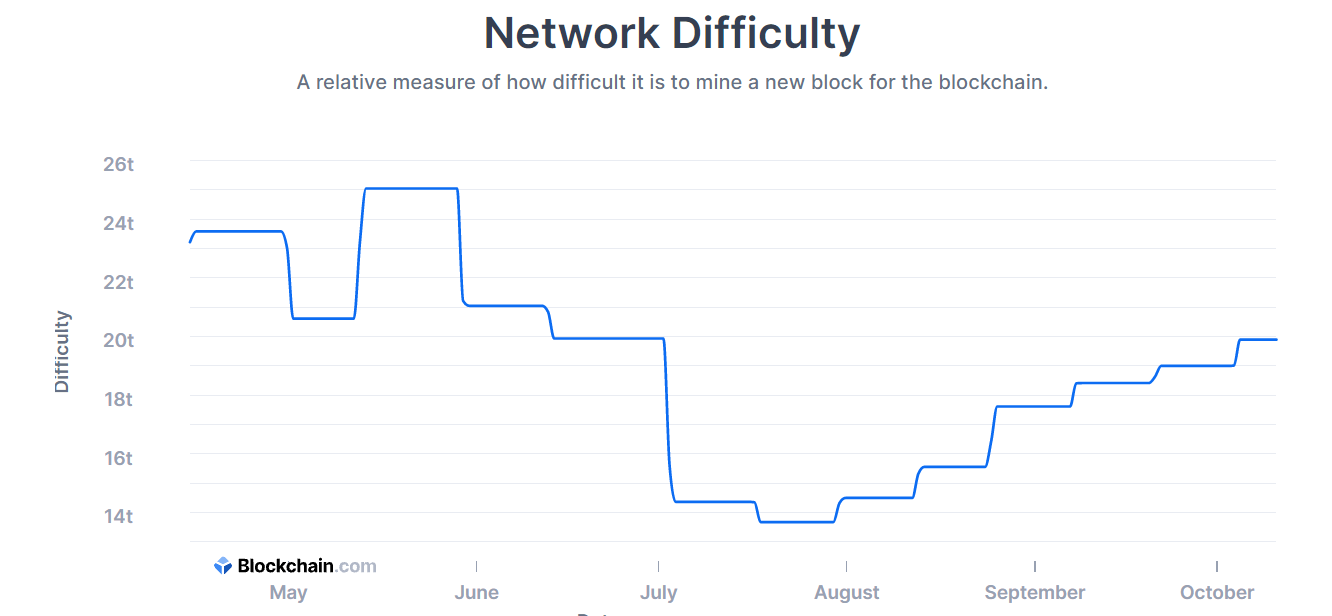
From last quarter it went up from 89 EH/s up to 180 EH/s. Backing up the strong bullish signal bitcoin price have had. Same case for the Bitcoin Mining Difficulty increasing from 14 trillion up to 19.009 trillion in October. Which also represents more compute power and more security in the network. The complexity is adjusted every 2016 blocks , which are roughly 2 weeks, meaning that the time between blocks continues to be every 10 minutes.
With this recovery on the Bitcoin network and with the high levels on the Bitcoin price around 57K USD at the moment, it has also increased the Bitcoin Miners.
Revenue from a total per day on June 27th of 388 BTC up to 1,245 BTC per day on August 23th and 1185 BTC per day on miners revenue on October 2nd.
BTC DERIVATIVES
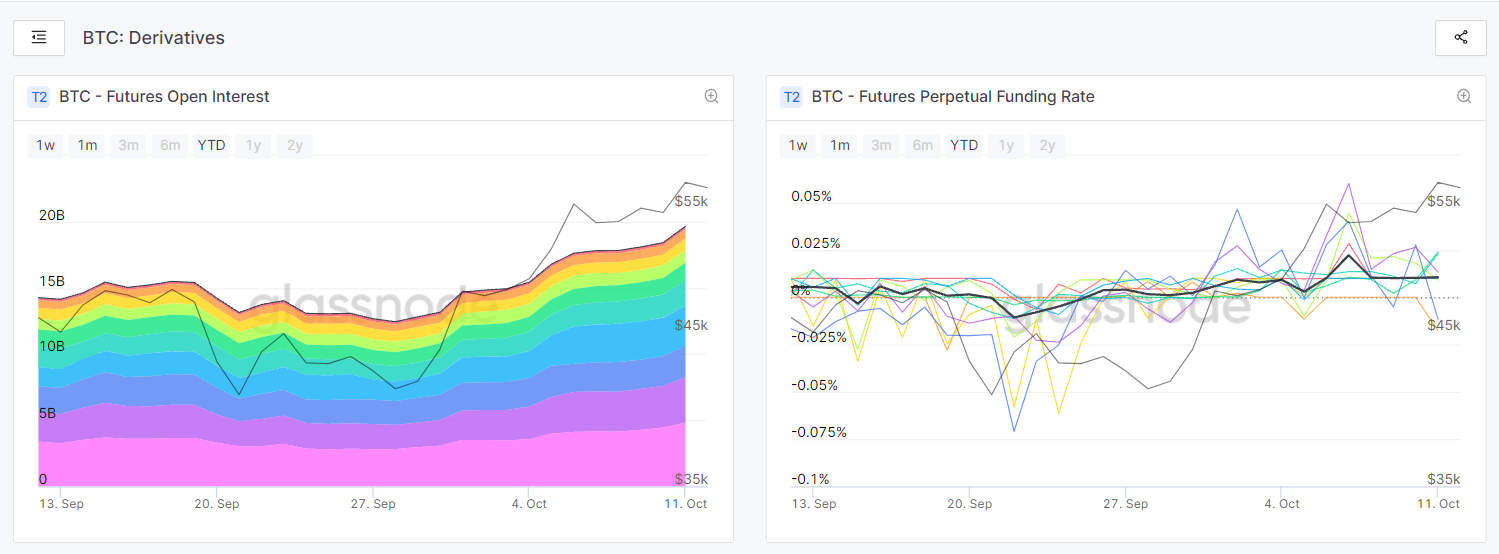
Derivatives traders are more active again, with open interest in bitcoin (BTC) futures going up significantly in recent days as BTC is testing the USD 57,000 level for the first time since May.
From July it has risen from 14BN USD up to 19BN USD on all exchanges. In regards to the FPFR or the Futures perpetual funding rate which is the mechanism used in order to ensure that the futures contract’s price stays close to the index or mark price. In order to stay close to the index price traders will either pay the opposite position or be paid by them. This is a way to incentivize traders to position themselves such that it drives convergence.
For example if most BTC futures contracts taken out are long, then those taking out a long will pay those shorting in order to keep BTC close to the index price.
On the contrary, if the majority of traders are taking short positions, they will pay traders taking a long position in order to keep BTC near the index price. These payments are automatically executed (taken or added to the trader’s margin) every 8 hours.
When observing the current rate for September, we can note that, most of the month has been a positive funding rate. (showing a strong bullish sentiment)
When looking at exchange analysis we can utilise the funding rate in order to see the general positions / sentiment of traders. We can then come to the following conclusion:
If the funding rate is positive – users are typically taking long positions and traders are overall bullish.
BTC FUTURES VOLUME
In regards to the total volume (USD) traded in future contracts per exchange over the last 24 hours.
We can observe Binance continues to be the leader with a volume of 32.3 BN USD, followed by OKEX with a volume of 9.4 BN USD then ByBit exchange with 8.4 BN USD. Both FTX and Huobi with a volume average on 5.5 BN USD and finalizing with CME with 2.4 BN USD and Bitmex with 1.9 BN USD repectively.
Both Future Volumes and Perpetual had a huge increase by mid September when they reached their highest level. 77 BN USD for Perpetual and 89 BN USD for Future Volumes.
So observing both the perpetual funding rate and the volumes we can confirm the bullish trend we have seen during September 2021 and continuing in October.
FUTURE LONG & SHORT POSITIONS LIQUIDATION
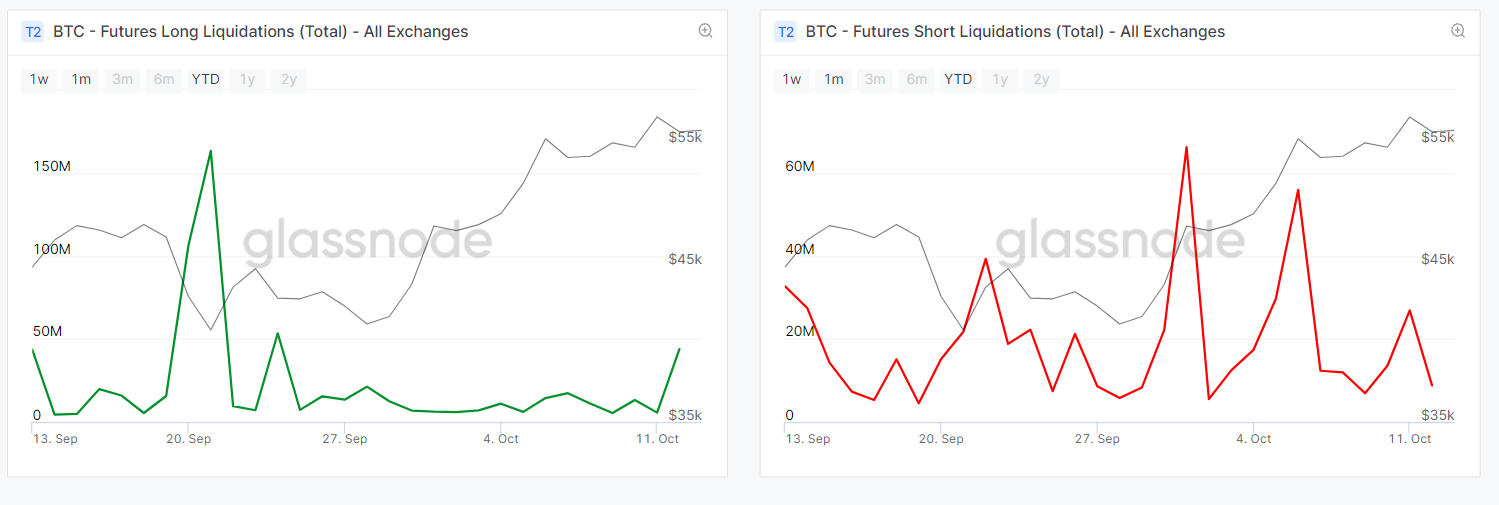
When observing the liquidations on the market for both Future Long positions and Short. There were a total of 163 MM USD Long positions liquidated on September 20th led by Bitmex with 80MM USD liquidations, OKEX with 52 MM USD and Binance Exchange with 29MM USD.
Same case ocurred with the short liquidations when in October 1st there were a total of 66 MM USD accross Binance (16MM USD) , BITMEX ( 34MM USD) and OKEX (15MM USD) respectively. And on October 6th with a total of 55MM USD with Binance with 17MM USD , BITMEX (10MM USD) and OKEX with 27MM USD.
BTC OPTIONS
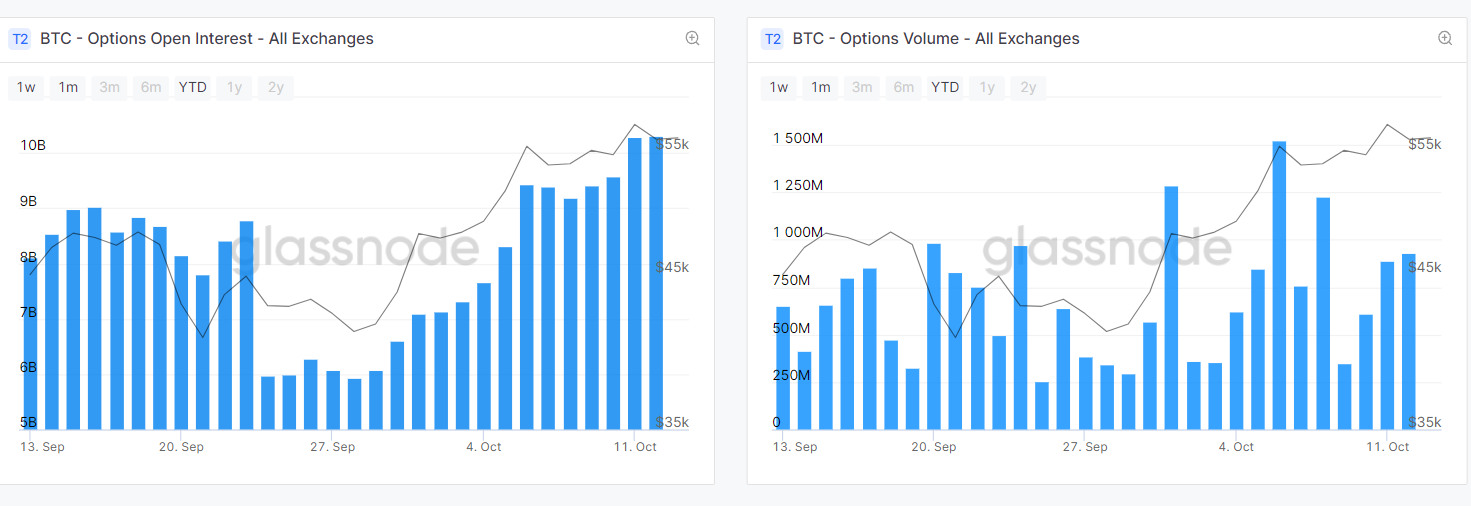
BTC Options are derivative instruments that give the purchaser the right to buy or sell the underlying asset at a predetermined price on or before a specific date. A call option gives the holder the right to buy, while the put buyer gets the right to sell. Open interest refers to a number of calls and put option contracts traded but not squared off with an offsetting position. A call buyer is implicitly bullish on the market, while a put buyer is bearish.
During September open interest on all exchanges was in the range of 8.1 BN USD and going up to 10BN USD during the first week of October.
NET TRANSFER VOLUME FROM / TO EXCHANGES
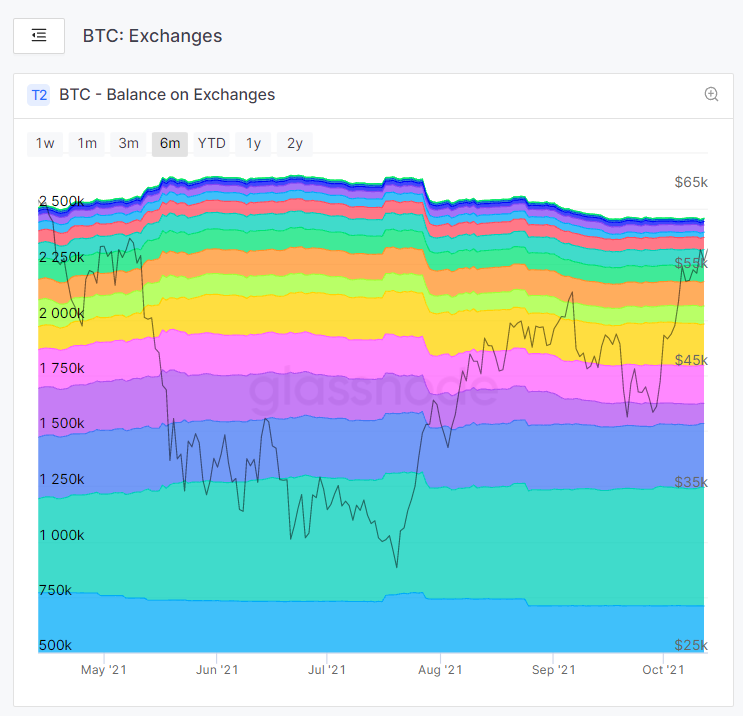
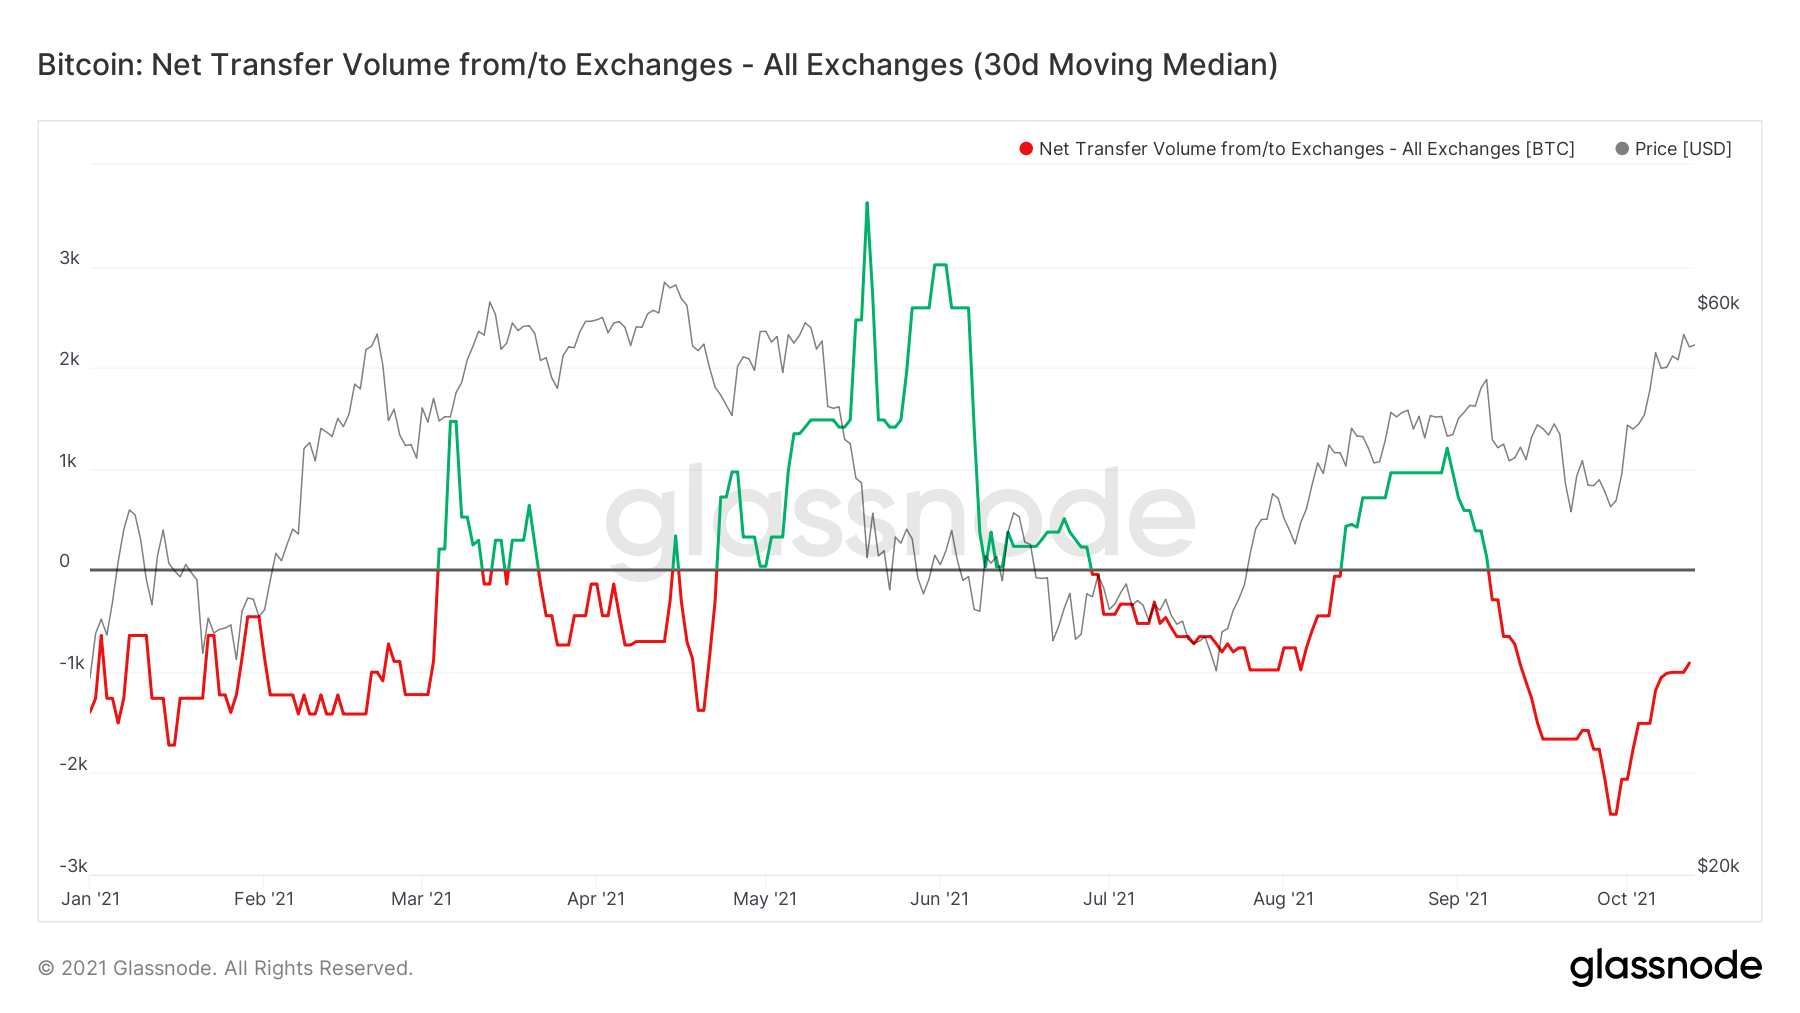
During Q2 2021 we can note that the volume on exchanges was positive from May to the end of June with balances fluctuating to exchanges from 724 BTC in April 2021 to a high inflow on May of 3,628 BTC. After that period we can observed how it decreased the inflows to almost 230 BTC by the end of June before going negative the net volume.
During Q3, the inflows have been mostly negative having the lowest point in August with almost -983 BTC flowing out from exchanges which got almost compesanted by an inflow of up to 1,206 BTC on August 30th. During the month of September that inflow from August was rapidly erased by the big outflow of -2,405 BTC on September 28th.
We can interpret the same trend of outflows from exchanges as the following:
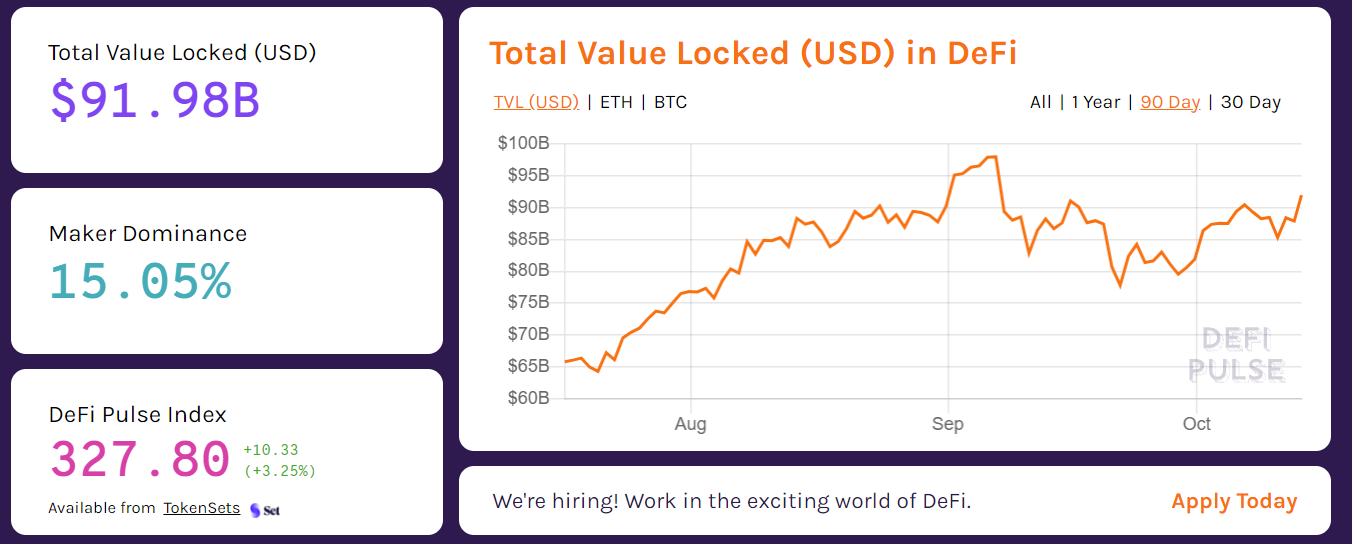
According to DeFi Pulse with more than 91 BN USD in total value locked (TVL) in Decentralized Finance (DeFi) applications and the growth of Decentralized Exchanges, we can understand how investors and people in general are moving their capital to Decentralized networks and exchanges instead of being managed by Centralized Crypto Exchanges.
While centralized exchanges are simple to use and are frequently the first port of call for new investors and traders, they come with a slew of downsides, which are gradually damaging their desirability among users.
Chief among these problems is the fact that they’re centralized. Not only does this pose a security risk, since a large sum of user funds are concentrated in a single place to create a large target for hackers, but it also means these exchanges are subject to the whims and wills of the governments of the jurisdictions in which they operate.
This problem was most recently seen when Binance — the world’s largest cryptocurrency spot exchange by trading volume — was forced to shutter its regulated activities in the UK by the country’s financial watchdog, the Financial Conduct Authority (FCA).
GRASYCALE PREMIUM
Grasycale Bitcoin Ttust (GBTC) enables accredited investors with a minimum entrance of 50K USD to gain exposure to the price movement of bitcoin through a traditional investment vehicle, without the challenges of buying, storing and safekeeping bitcoins.
Currently with over 36 BN USD of Assets under Management and with a holding of 647,642 bitcoin (BTC) and a share of the price of USD 42.40. The Trust gives the opportunity to investors every six month to secondary market trading and the shares are eligible to become unrestricted. The well known “Grayscale Unlock” moment which always create sentiment in the Bitcoin and Crypto - markets. Because once the unlock of shares happens the investors have the opportunity to buy Bitcoin (BTC) on the spot.
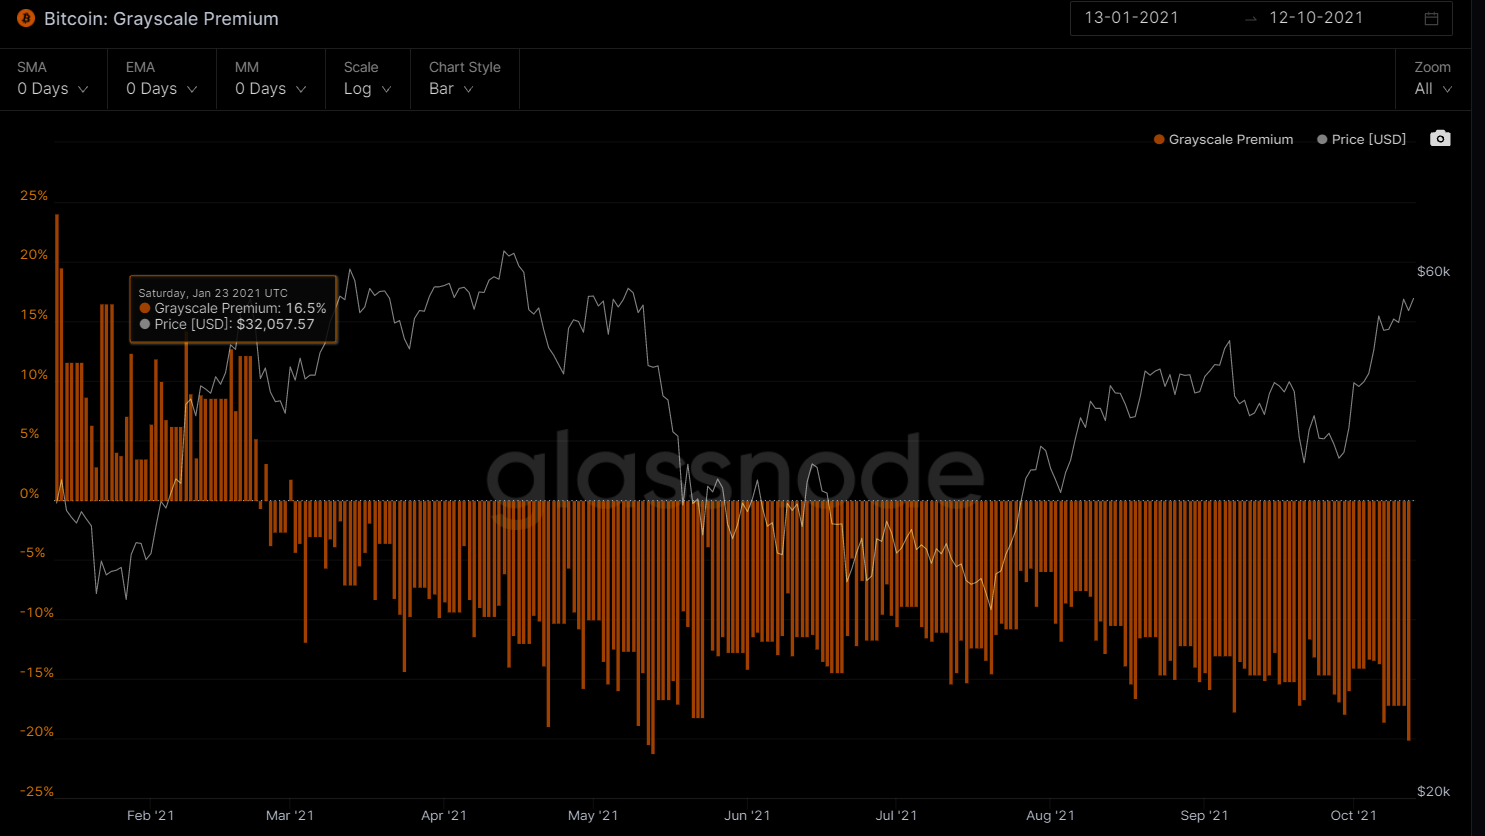
This procedure for investors within GBTC was profitable as long the Grayscale indicator was premium. But Grayscale premium indicator has been negative for the most part of 2021 since February.
During Q3 it started on July with a NAV of -10.52% and continuing the negative trend down to -15.92% on September. On October the first 2 weeks it has reached a new level of -20.06 %.
HASH RIBBON
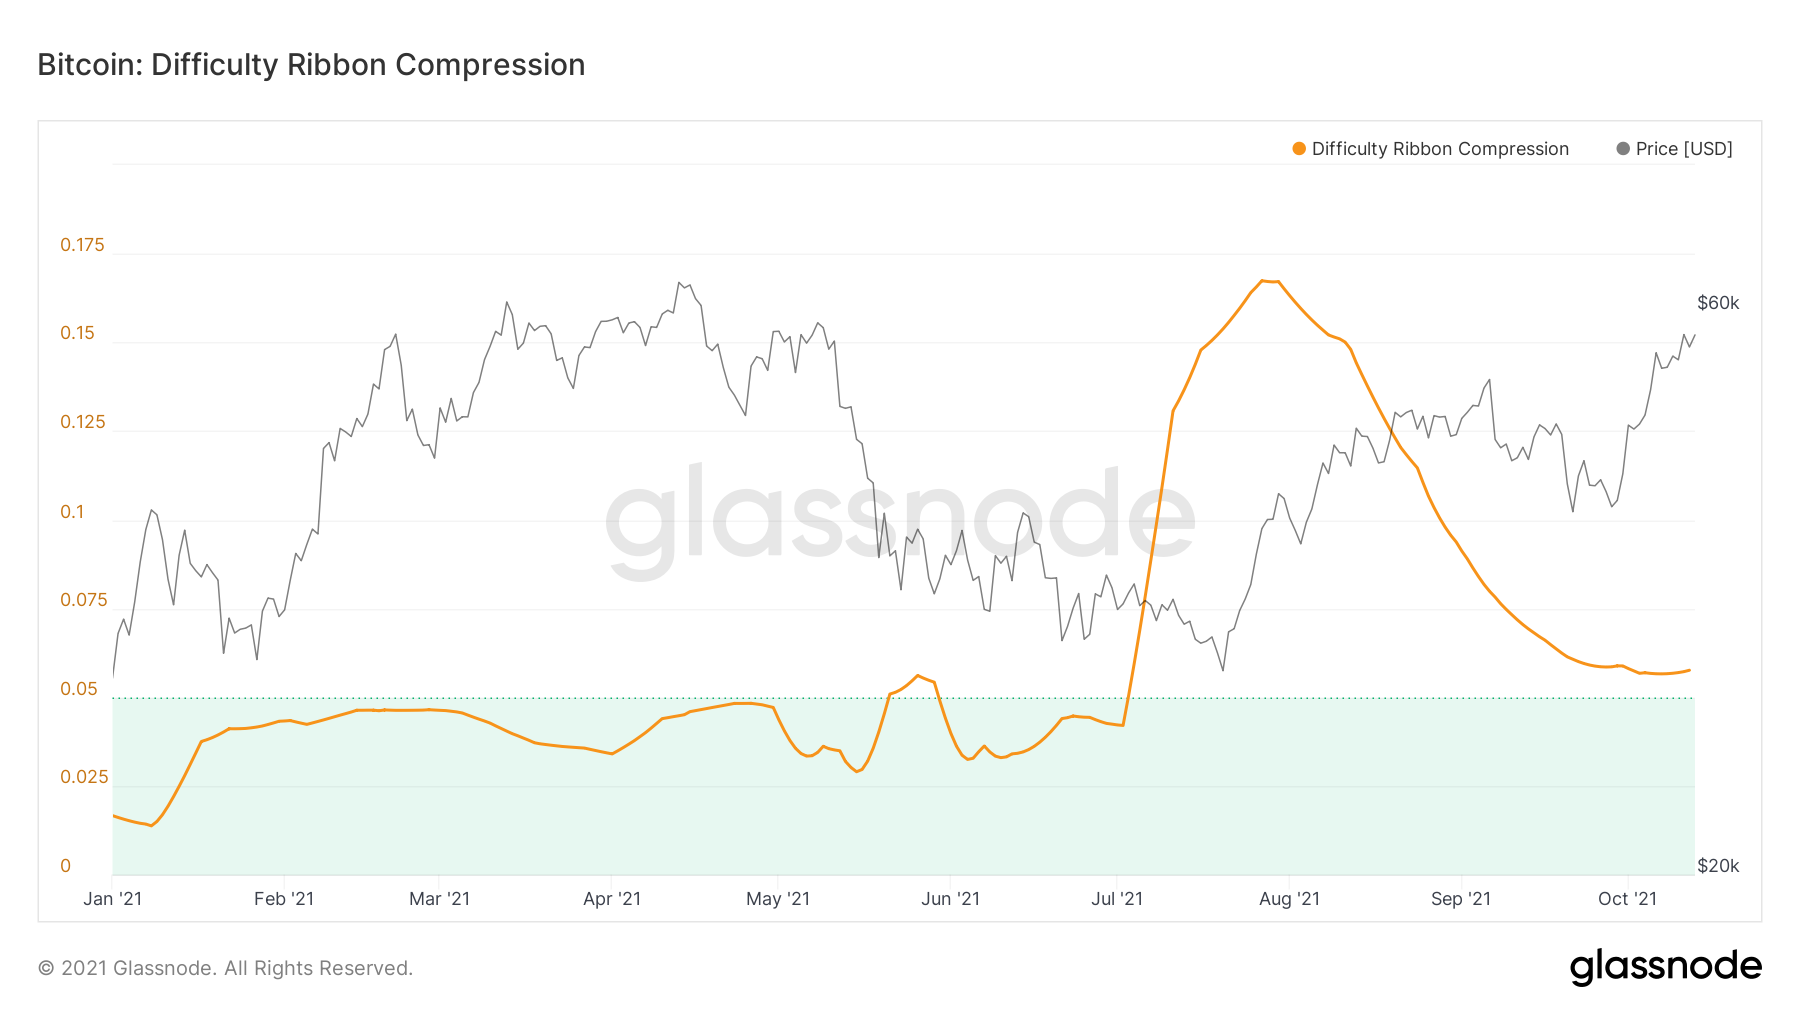
When the ribbon compresses, or flips negative, these are the best times to buy Bitcoin. The ribbon consists of simple moving averages on mining difficulty so we can easily see the rate of change in difficulty.
This visualisation of network mining difficulty speaks to the impact of mining on Bitcoin's price. As new coins are mined into existence, miners sell some of their mined coins to pay for production costs. This produces bearish price pressure.
We can see how at the end of August 2021 were compressed and the moving average of 30days surpassed 60days moving average indicating a good buy signal opportunity.
The weakest miners sell more of their coins to remain operational. When it becomes unsustainable, they capitulate, hashing power and network difficulty reduces (ribbon compression), leaving only the strong, who sell less leaving more room for more bullish price action.
Typically we see this at the end of bear cycles, after miners capitulate, the lack of miner selling pressure allows the price to stabilise and then climb; the classic accumulation bottom.
That´s all for today. Remember to subscribe to our newsletter here


