Welcome to another edition of our Weekly Recap, where we take a look at the movements, behaviors, statistics and news regarding the most relevant tokens in the market, along with a quick review of the state of the DeFi sector, the best performing tokens and stablecoins during the week. Let’s begin:
TOP CRYPTOCURRENCIES
BITCOIN - BTC
In a somewhat unexpected turn of events, BTC (and the market as a whole) dropped significantly this week, from an all-time high of over $58,000 down to $44,000m, representing losses of over 20'% and marking this as the biggest losses since last March, where the beginning of the pandemic and lockdowns forced people to sell their assets.
Analysts claim that this is a similar situation to some degree. In a note, Craig Erlam, a senior market analyst at OANDA Europe, said BTC “is a market that was ridiculously overbought and will probably be so once again in the not-too-distant future” and that most rallies we’ve seen recently aren’t necessarily sustainable. This, along with a drastic increase in the volatility in global markets and the expiry of multiple options, may have been the catalyst for the week’s intensive selloff, pulling the token down drastically.
Among institutional news, Square Inc., the California-based financial service aggregator and mobile payments company, purchased nearly $170 million in BTC, which at the time was valued at $51,235 per unit, following their $50 million purchase in October 2020, joining MicroStrategy’s group of companies that are making numerous purchases of the token instead of just a one-time purchase.
Also, Coinbase released their public S-1 form, a form that companies planning to go public need to file to the SEC, paving their way to be traded on U.S. equity markets. However, this form proved more useful than expected, since analysts are extracting valuable information from it. In a Twitter thread, Ryan Selkis, founder of Messari, highlights that Coinbase reports 43 million verified users, 2.8 million monthly active users, $456 billion in total trading volume and $90 billion in assets on the platform, along with how transaction fees represent 96% of their revenue, which reached $1.3 billion in 2020 alone.
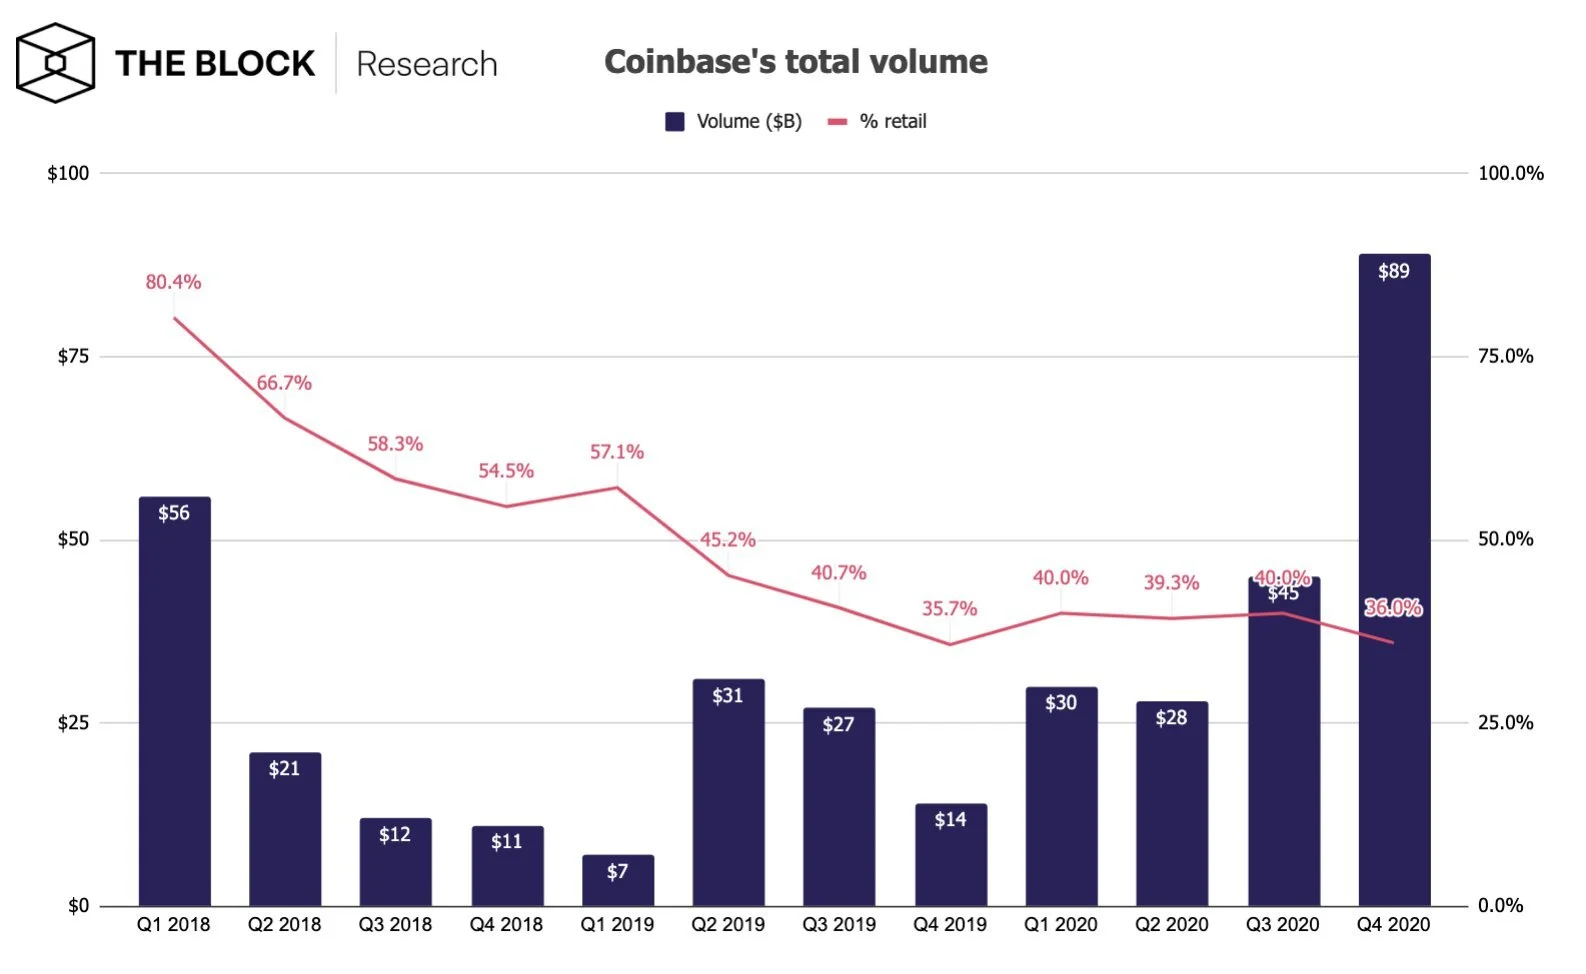
Another important piece of information comes from the chart showing trading volumes vs percentage of said volume coming from retail, which shows that the trend of institutionalization has been going on for a couple of years. This comes as no surprise, since institutions have shown increased interest in cryptocurrencies during this time, but works as undisputable proof that institutions are now nearly twice as relevant as retail users in terms of trading volumes, but the vast majority of the holding is held by these lower-scale users, as shown in the Glassnode’s analysis we covered a few weeks ago.
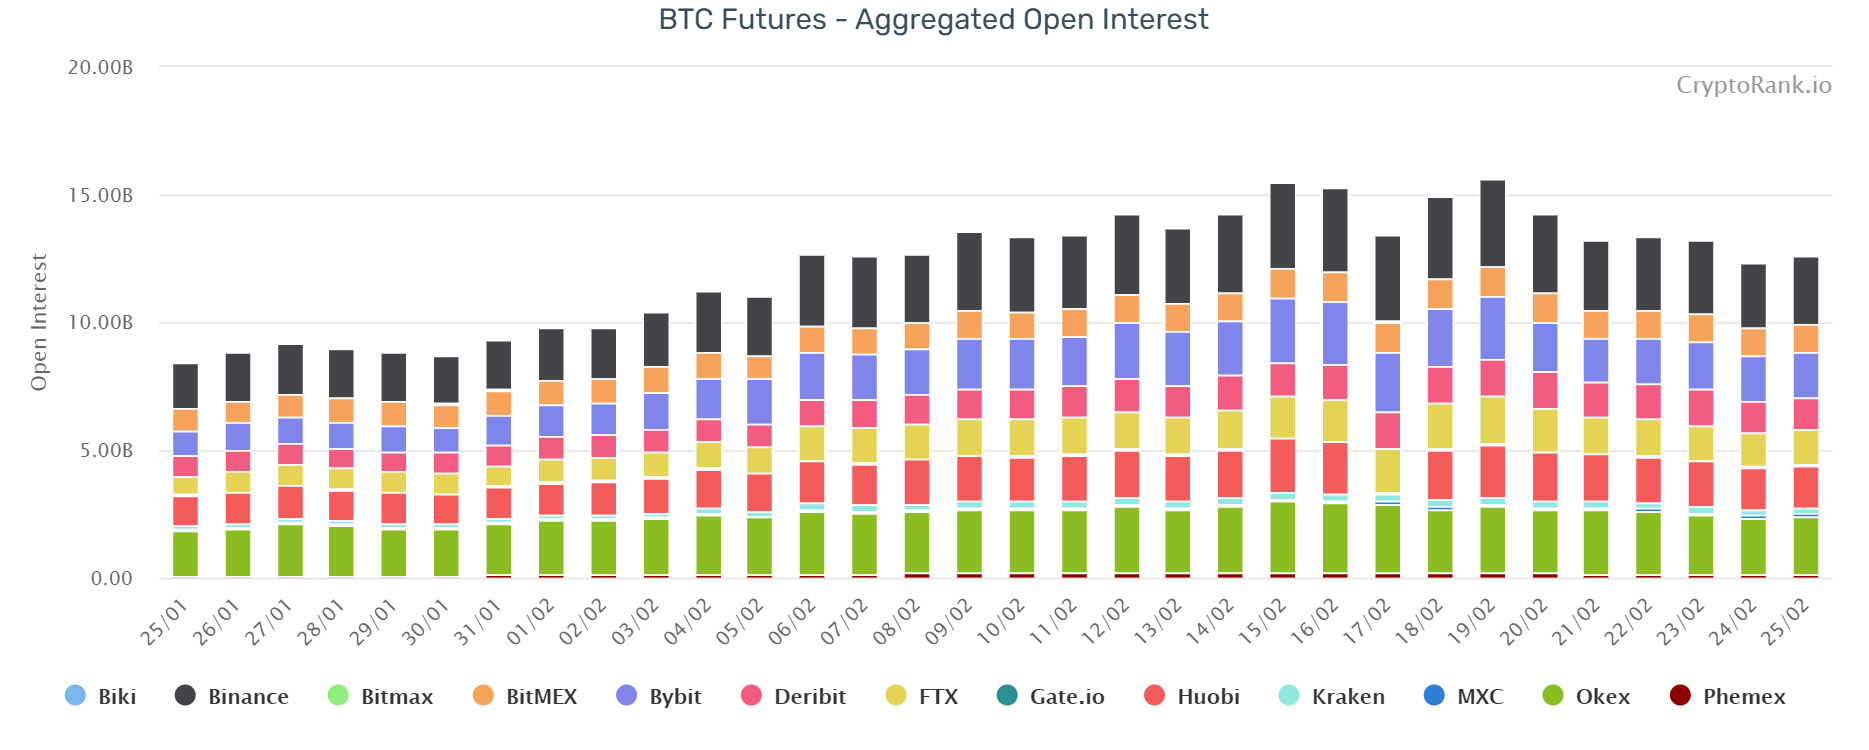
The derivatives market shows a clear uptick in trading volumes on February 21st, which was then followed by reductions in open interest. This spike represents the massive selloff we mentioned earlier, which was one of the catalysts for the massive price drop in the token’s value. It’s important to note how, after the drop, trading volumes have remained relatively similar to previous weeks, which could be interpreted as a lack of intention to reverse the situation, probably fueled by skepticism coming from the drop.
ETHEREUM - ETH
Similar to BTC, ETH also experienced a drop of over 20% during the week, brought forward by massive selloffs and the overall sense of volatility in the market, which is also boosted by said sales as users consider these movements as a sign of investors “opting out”, prompting them to opt out themselves. This event proves once again that, even if they are not competitors or even targeted for the same audiences and use cases, BTC and ETH move in a very similar manner to each other when factors alter the behavior of the market itself.
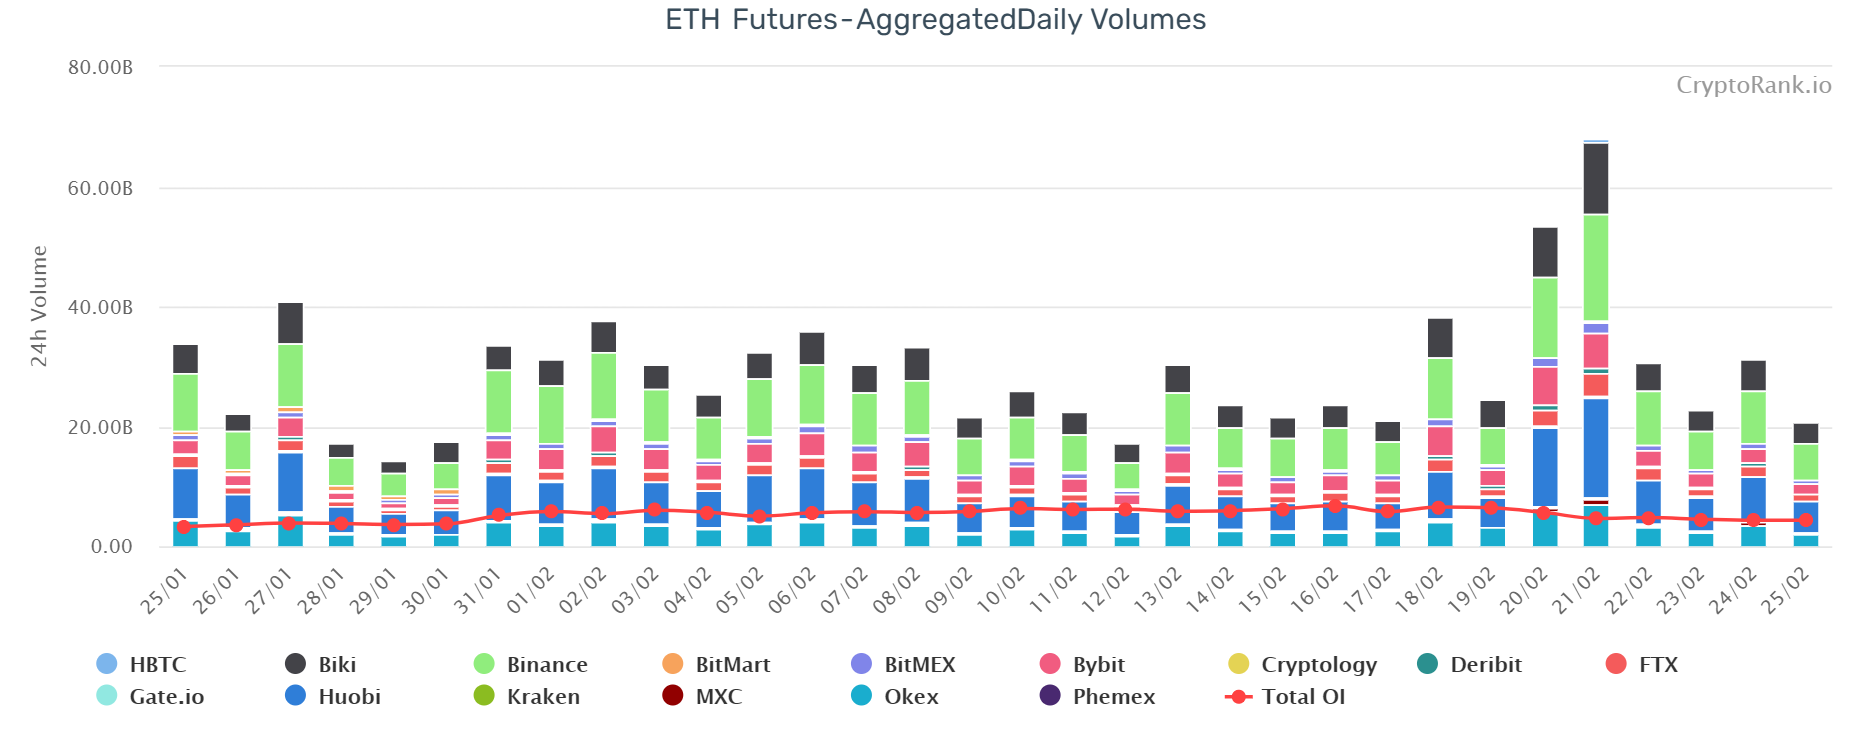
ETH derivatives show the same pattern as BTC’s: a spike on the 21st linked to the selloff during the weekend and open interests pointing downward. As it stands, indicators point towards a lack of confidence in a bounce-back towards a climb in the upcoming weeks, but the last month has shown us once again how unpredictable this market can be.
POLKADOT - DOT
Out of the biggest tokens in the market, DOT was the one to lose the less value during the week, only dropping 10% and now trading around $34. This could be a sign of a disconnection between DOT and its main competitor, ETH, as it has been a couple of weeks of the competing tokens behaving very similarly.
CHAINLINK - LINK
As expected, LINK behaved as any ERC-20 token would, following the downward trend of ETH but managing to bounce back a little bit in the last couple of hours, leaving it at around $26 at the time of writing.
DEFI
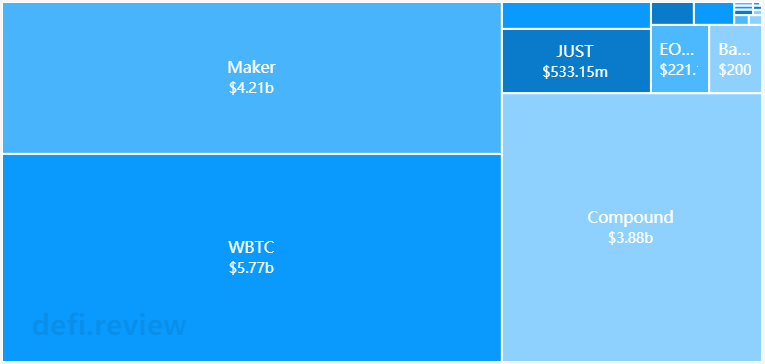
This week in DeFi was also marked drastically by the sudden drops in the market. While the TVL dropped nearly $10 billion for the first time, it also registered its all-time high drop of 21%. This is basically a sign of the constant and tight connection between ETH and the DeFi platforms, which the great majority allow for the creation of lending contracts in the Ethereum network. A relevant point to highlight is how Uniswap continues to grow and eclipse the other Dapps in this sector of the market:
UNISWAP - UNI
As mentioned before, Uniswap managed to increase the gap between itself and the rest of Dapps, despite reporting loses of 15% and currently trading around $23.
COMPOUND - COMP
COMP appears to be one of the tokens that suffered the least from the drops, showing calculated losses of 17% after a big recovery effort following the lowest point of the week, climbing from $341 to $460 before oscillating and dropping back a bit more. This could be caused by the publicly governed nature of Compound, meaning that users had a chance to implement corrective measures, but eventually noticing a point of non-sustainability.
SYNTHETIX - SNX
Similar to other DeFi tokens, SNX registered losses around 20% and its now trading around $19.50. However, it does seem to be the token that showed the greatest drop in terms of market capitalization, which could be linked to how not only SNX drops in value, but also how the associated assets to their Synths also drop in value.
LENDING PROTOCOLS
BIG MOVERS
STABLECOINS
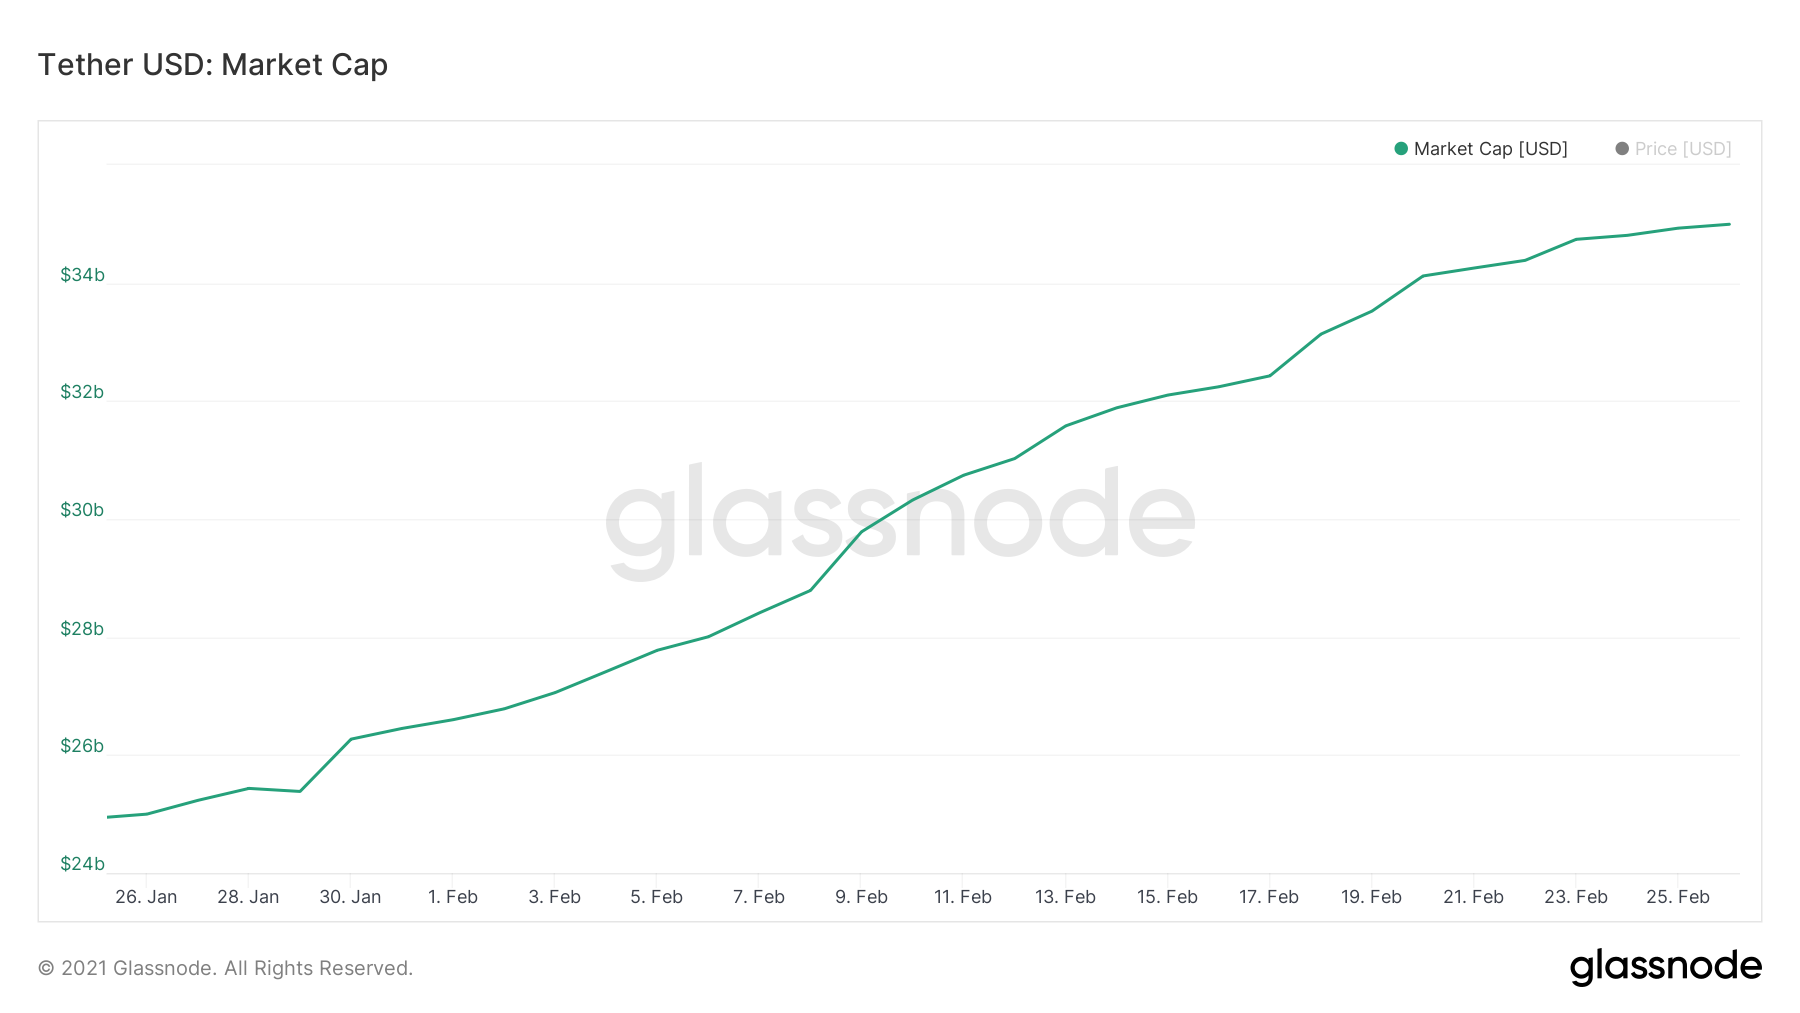
1 - USDT: $ 1.00, with a market cap of $ 34.99 B and a trading volume of $ 532.38 M.
2 - USDC: $ 1.00, with a market cap of $ 8.85 B and a trading volume of $ 193.78 M.
3 - DAI: $ 1.00, with a market cap of $ 2.26 B and a trading volume of $ 19.97 M.


